
Thinking of getting good marks in Data Interpretation? Are you looking for Data Interpretation Questions with Solutions to boost your marks in Data Interpretation?
Are you preparing for competitive exams and not able to find good Data Interpretation In Hindi Questions?
Don’t worry, here we have a solution for you of getting Data Interpretation In Hindi Questions.
Trust me, after going through this post, your search for Data Interpretation In Hindi will be ended. So let’s start a ride of Data Interpretation In Hindi Questions.
5 Quality Data Interpretation In Hindi Questions
Data Interpretation Questions with Solutions
Set-1
Study the following graph carefully and answer the given questions:
The line graph shows the number of cars manufactured in six different months in two different companies
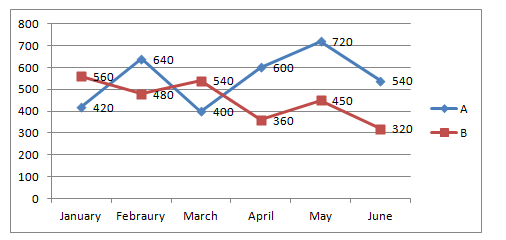
1. What is the ratio of 120% of the number of cars manufactured by company A on January and April together to the 80% of the number of cars sold by company B in march and June together?
2. Number of cars manufactured by company B on March and April together is what percentage more/less than the number of cars manufactured by company A on January and June together?
3. If the number of cars manufactured by company B on July is 120% of the average number of cars manufactured by company A for all the months together (Exclude February and march ), and then find the number of cars manufactured by B on July
4. What is the difference between the total number of cars manufactured by company A and the total number of cars manufactured by company B?
5. In which of the following month the difference between the number of cars manufactured by company A and B is maximum?
Data Interpretation Questions with Solutions
Set-2
Study the following graph carefully and answer the given questions:
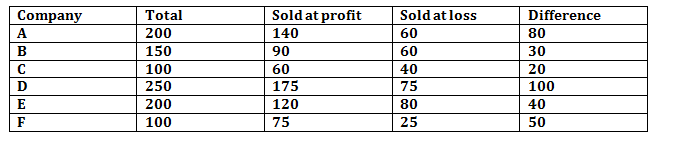
The pie chart shows the percentage distribution of the number of bags sold by six different companies
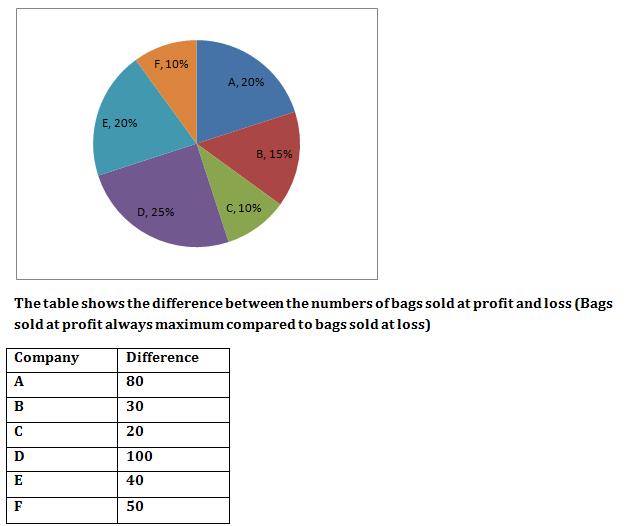
Total difference is 32% of the total number of bags sold by all the companies together
1. Number of bags sold by company B at profit is what percentage more/less than the number of bags sold by company C at loss?
2. What is the ratio of the number of bags sold by company A and C at profit to the number of bags sold by company D and F at loss?
3. What is the average number of bags sold by all the companies at profit?
4. In which company the number of bags sold at loss is maximum?
5. Which company sold the bags closest to the average number of bags sold by all the companies together?
Data Interpretation Questions with Solutions
Set-3
Study the following graph carefully and answer the given questions
The following table shows the number of students participated in Volley ball, cricket and other games in five different schools
1. What is the difference between the total number of students participated in volley ball from school A and D and the total number of students participated in cricket from school B and C?

2. Find the total number of students participated in other games from all the schools
3. If a total student in school F is 20% more than the total number of students participated in cricket from schools E and C together, and then find the total students in school F
4. What is the difference between the total number of students participated in volley ball and the total number of students participated in Cricket?
5. In which school has maximum students participated in other games?
Data Interpretation Questions with Solutions
Set-4
Study the following graph carefully and answer the given questions
The pie chart shows the percentage distribution of number of students applied for two competitive exams (IBPS PO and SBI PO) in different years


1. Find the total number of students applied SBI PO exams in 2012 and 2016 together, if the total number of students applied in the year 2014 is 4500
2. What is the ratio of the number of students applied IBPS PO exam in 2013 and 2015 together to the total number of students applied SBI PO exam in same years?
3. What is the difference between the total number of students applied IBPS PO in the year 2013, 2014 and 2015 and the total number of students applied SBI PO in the same years, if the total number of students applied in the year 2012 is 4000?
4. Number of students applied for SBI PO exam in 2016 is what percentage more/less than the number of students applied for IBPS PO exam in 2014?
5. In which year has maximum difference of the number of students applied for IBPS PO and SBI PO?
Data Interpretation Questions with Solutions
Set-5
Refer to the table and answer the following questions:
1. If the number of male post graduate employees in company H is 1800, what percent of the female employees in that particular company are post graduate?
2. In which of the given companies is the percentage of women employees with respect to the total number of employees (both males and females) in that company the second lowest?
3. What is the ratio of the total number of male employees in companies B and H together to the total number of female employees in Companies C and D together?
4. What is the difference between the average number of post graduate employees in companies A, B and D together and the average number of post graduate employees in companies F, G and H?
5. Which of the given companies has the highest number of average employees per office?