Set-123
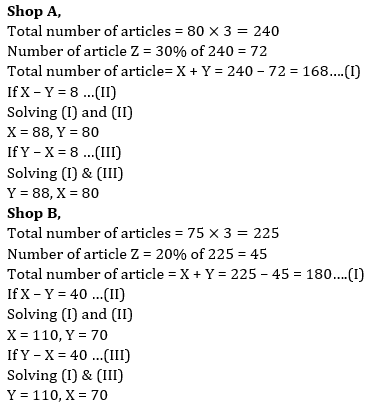
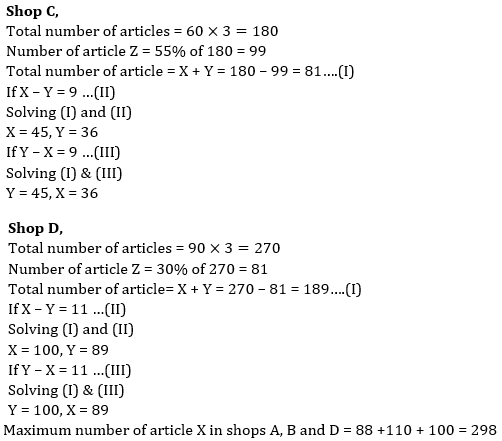
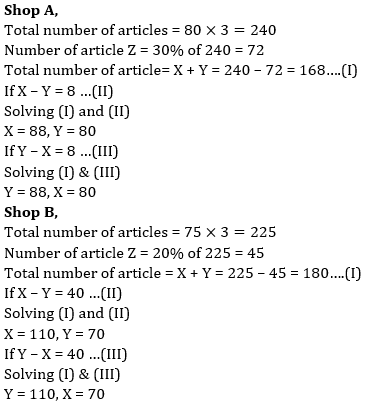
The table shows three different articles (X, Y & Z) sell by four different shops (A, B, C & D). Read the table carefully and answer the following questions.

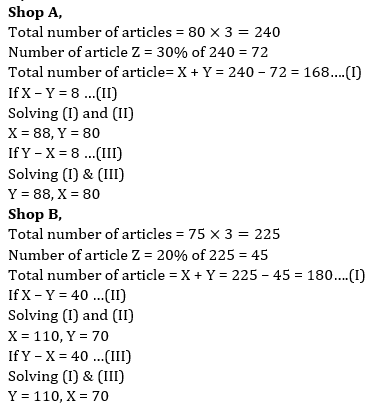
1. Find the maximum number of article X in shops A, B and D.
1. 298
2. 290
3. 291
4. 279
5. 299
2. Maximum number of article Y in shop B and D together is what percentage more than that of minimum number of article X in shop A and B.
1. 10%
2. 20%
3. 30%
4. 40%
5. 50%

3. Find the difference between total number of article X & Y together and total number of article Z in all the shops.
1. 321
2. 220
3. 221
4. 311
5. 299


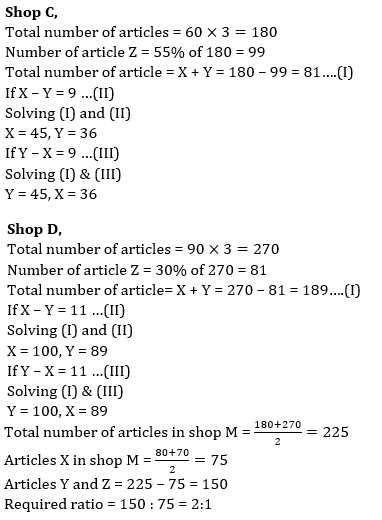
4. If in shop M, total number of articles is equal to average number of articles in shops C and D together and number of article X is equal to average of minimum number of article X in shops A and B, then find the ratio of number of article Y and Z together to article X in shop M.
1. 3:1
2. 2:3
3. 2:1
4. 1:1
5. 2:9
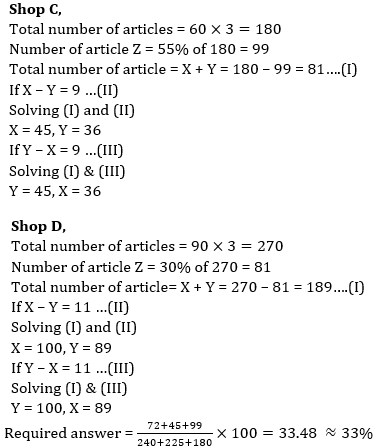
5. Number of article Z in shops A, B & C is approximately what percentage of total number of articles in same shops.
1. 11%
2. 22%
3. 33%
4. 44%
5. 55%

Set-124
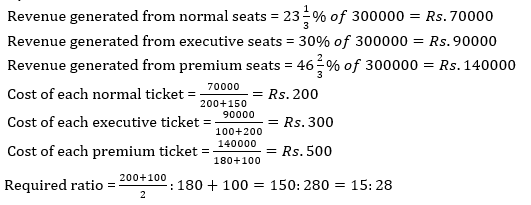
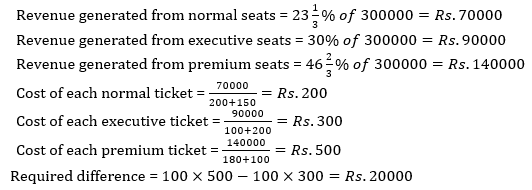
Given pie chart shows the total revenue generated by a theatre on Friday. Bar graph shows the ticket booked for three different types of seats (Normal, Executive and Premium) of two different movies (A and B) on same day.
Note: Total number of seats = Vacant seats + Booked seat.


1. Find the revenue generated by movie A from executive seats is how much more/less than revenue generated by movie B from premium seats.
1. Rs.20000
2. Rs.22000
3. Rs.24000
4. Rs.26000
5. Rs.28000
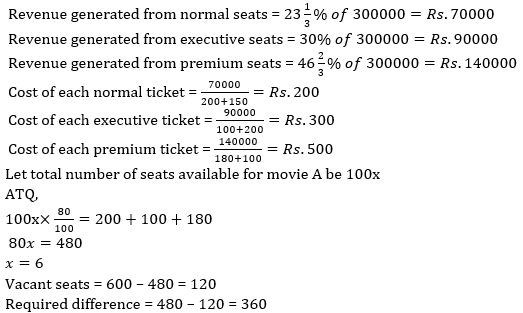
2. Total number of seats booked for movie A is 20% less than total number of seats available for movie A. Find the difference between vacant and booked seats for movie A.
1. 60
2. 120
3. 180
4. 360
5. 390
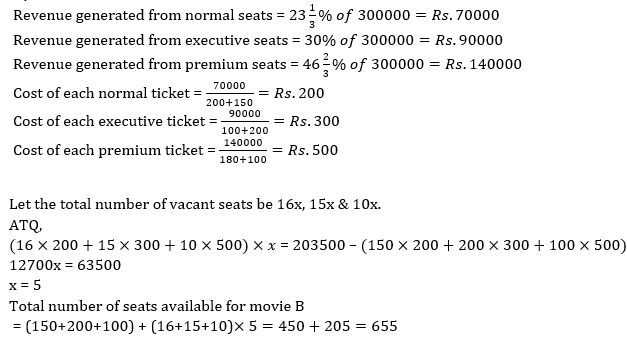
3. If on Friday movie B is a house full, then total revenue generated become Rs.203500. Ratio of vacant seats in normal, executive and premium is 16:15:10 respectively. Find the total number of seats available for movie B.
1. 600
2. 622
3. 680
4. 666
5. 655
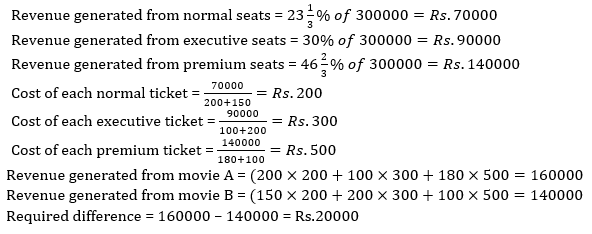
4. Find the difference between revenue generated from movie A and B.
1. Rs.20000
2. Rs.25500
3. Rs.21000
4. Rs.29500
5. Rs.26500
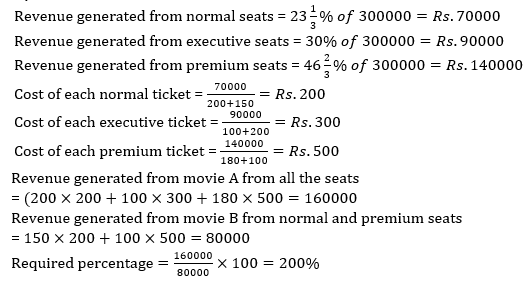
5. Total revenue generated from movie A from all the seats is what percentage of revenue generated from movie B from normal and premium seats together?
1. 50%
2. 100%
3. 150%
4. 200%
5. 250%
6. Find the ratio of average number of executive and normal tickets booked for movie A to total number of premium tickets booked for movie A and movie B.
1. 60:61
2. 1:20
3. 15:28
4. 36:31
5. 28:15