Data Interpretation Questions for Competitive Exams Data Interpretation: Data Interpretation Questions are usually asked in all competitive exams like SSC, SBI, IBPS, RBI, LIC, RRB, AAI, DRDO, ISRO, NTR, FSSAI, CWC, LIC, SSC CGL, Railways and other state government exams. |
ntitative Aptitude. Most of the questions come from Data Interpretation in Quantitative Aptitude section.
Set-25
Study the following information carefully and answer the given questions:
The given bar graph shows the number of students in three different departments in four different colleges.
1. What is the ratio of the total number of students in EEE departments in all the colleges together to the total number of students in CSE departments in all the colleges together?
2. What is the difference between the average number of students in college D and A in all the departments together?
3. The number of EEE students in C is approximately what percent of the number of ECE students in B?
4. The total number of students in C in all the departments together is approximately what percent of the total number of students in B in all the departments together?
5. What is the average number of ECE students in all the colleges together?
Set-26
Study the following information carefully and answer the given questions:
The pie chart shows the number of students like five different sports.
The given table shows the number of boys to girls like five different sports.
6. What is total number of boys like all the sports together?
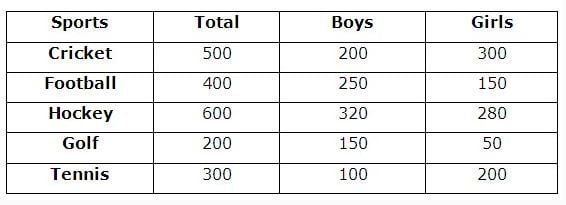
7. The number of girls likeFootball is approximately what percent of the number of boys like Cricket?
8. What is the ratio of the number of girls like Golf to the number of girls like Tennis?
9. The number of boys like Hockey is approximately what percent of the number of students like Hockey?
10. What is the difference between the total number of boys and girls like all the sports together?