Data Interpretation Questions for Competitive Exams Data Interpretation: Data Interpretation Questions are usually asked in all competitive exams like SSC, SBI, IBPS, RBI, LIC, RRB, AAI, DRDO, ISRO, NTR, FSSAI, CWC, LIC, SSC CGL, Railways and other state government exams. |
Set-33
The following table shows the number (lakhs) of TV sets manufactured by six companies over the years
1. What is the average number of TV sets manufactured by company C for all the given years?
2. The number of TV sets manufactured by company E in 2004 is approximately what percent of the total number of TV sets manufactured by all the companies together in 2004 ?
3. What is the ratio between the total number TV sets manufactured by all the companies together in 2006 and that in 2007 respectively?
4. Total number of TV’s manufactured by company A is approx. what percent of the total TVs manufactured by company F for all the given years together ?
5. The number of TVs manufactured by company A is approx. what percent of the total number of TVs manufactured by company B in all the years together ?
Set-34
Study the following information carefully and answer the questions given below:
Profit made by companied X, Y and Z in various years are:
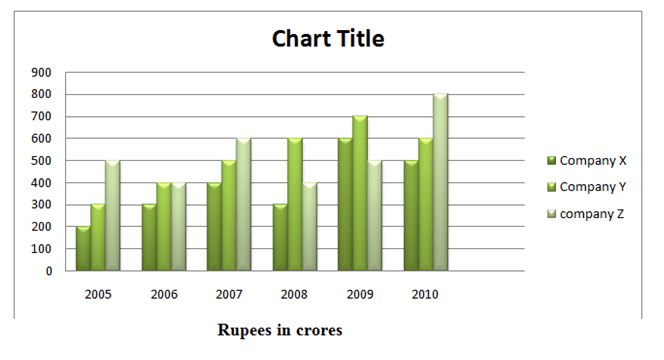
6. What is the difference between lowest profit made by any company in any year and highest profit made by any company in any year?
7. What is the growth of company Y’s profit in 2008 as compared to previous year?
8. Which year the quantum of profit made by any two company the same?
9. In which year the total profit of all the companies highest?
10. Between 2005 and 2010, in two years all the three companies have shown positive growth in profits. One of the year is 2007 and the other is?