Set-41
Read the following table and answer the following question.
निम्नलिखित तालिका को पढ़िए और निम्नलिखित प्रश्नों के उत्तर दीजिये।
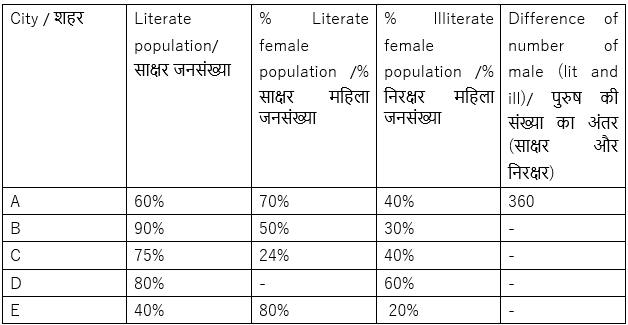
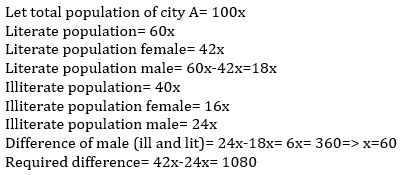
1. Find the difference between literate female of city A and illiterate male in city A.
शहर A की साक्षर महिला और शहर A के निरक्षर पुरुष के बीच अंतर ज्ञात कीजिए।
1. 1080
2. 540
3. 1000
4. 2000
5. 2456
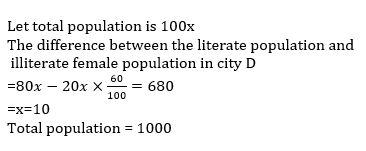
2. The difference between the literate population and illiterate female populations in city D is 680. Find the total population of city D.
शहर D में साक्षर जनसंख्या और निरक्षर महिला जनसंख्या के बीच का अंतर 680 है। शहर D की कुल जनसंख्या ज्ञात कीजिए।
1. 1000
2. 2000
3. 1500
4. 6900
5. 7000
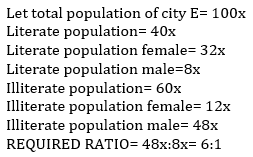
3. Find the ratio of illiterate male in city E to the literate male in city E.
शहर E में निरक्षर पुरुषों का शहर E में साक्षर पुरुषों से अनुपात ज्ञात कीजिए।
1. 1:6
2. 6:1
3. 3:2
4. 2:3
5. 1:1
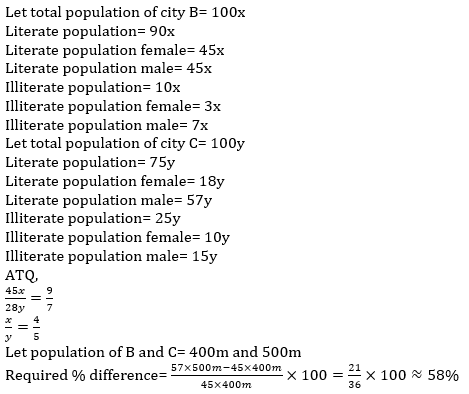
4. The ratio of literate male population of city B to the total female population of city C is 9:7. Find the male literate population of city C is what percent more or less of female literate population of city B.(approx.)
शहर B की साक्षर पुरुष जनसंख्या का शहर C की कुल महिला जनसंख्या से अनुपात 9:7 है। ज्ञात कीजिए कि शहर C की पुरुष साक्षर जनसंख्या शहर B की महिला साक्षर जनसंख्या से कितने प्रतिशत अधिक या कम है। (लगभग)
1. 11%
2. 48%
3. 58%
4. 20%
5. 30%
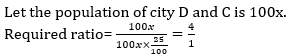
5. Find the ratio of total population of city D to the illiterate population of city C if population of both the cities are equal.
यदि दोनों शहरों की जनसंख्या समान है, तो शहर D की कुल जनसंख्या का शहर C की निरक्षर जनसंख्या से अनुपात ज्ञात कीजिए।
1. 2:1
2. 1:2
3. 3:2
4. 1:4
5. 4:1
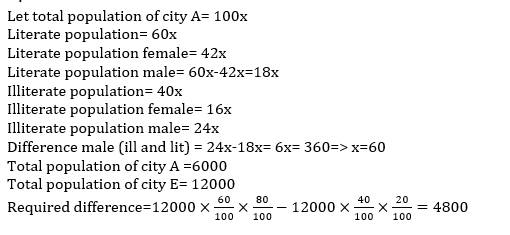
6. The ratio of total population of city A and city E is 1:2. find the difference between literate male population of E and illiterate male population of city E.
शहर A और शहर E की कुल जनसंख्या का अनुपात 1:2 है। शहर E की साक्षर पुरुष जनसंख्या और शहर E की निरक्षर पुरुष जनसंख्या के बीच अंतर ज्ञात कीजिए।
1. 300
2. 600
3. 1200
4. 2400
5. 4800
Set-42
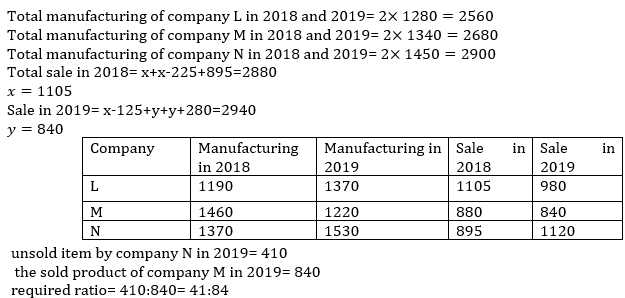
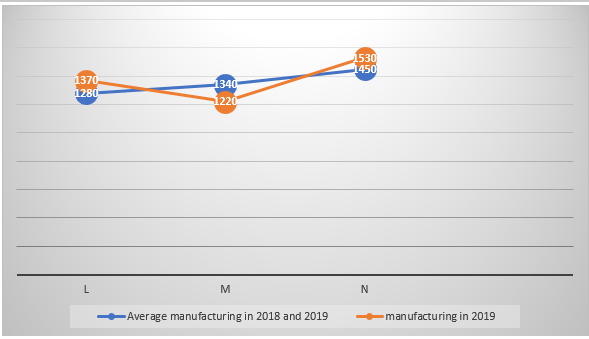
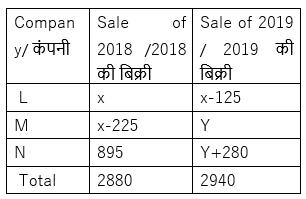
The line graph shows the data of average manufacturing in 2018 and 2019 and manufacturing in 2019 of three companies, i.e., L, M and N. the table shows the sales data of 2018 and 2019.
लाइन ग्राफ तीन कंपनियों- L, M और N का 2018 और 2019 में औसत विनिर्माण और 2019 में विनिर्माण के आंकड़ों को दर्शाता है। तालिका 2018 और 2019 के बिक्री के आंकड़ों को दर्शाती है।
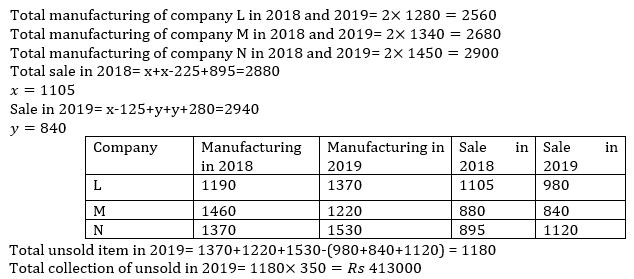
1. If unsold products of 2019 are later sold to a wholesaler at Rs. 350 each then find the total collection from unsold products in 2019.
यदि 2019 के बिना बिके उत्पादों को बाद में एक थोक व्यापारी को 350 रुपये पर बेचा जाता है, तो 2019 में बिना बिके उत्पादों का कुल संग्रह ज्ञात कीजिए।
1. 413000
2. 51300
3. 41300
4. 431000
5. 143678
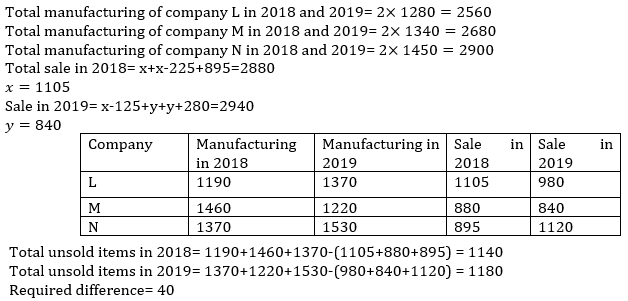
2. Find the difference between the total unsold product of 2018 and the total unsold product of 2019.
2018 के कुल बिना बिके उत्पाद और 2019 के कुल बिना बिके उत्पाद के बीच का अंतर ज्ञात कीजिए।
1. 80
2. 40
3. 50
4. 30
5. 10
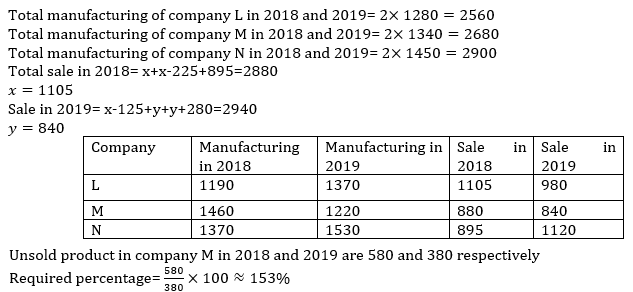
3. Total unsold products of company M in 2018 is what percent of total unsold products of the same company in 2019. (approx.)
2018 में कंपनी M के कुल बिना बिके उत्पाद 2019 में समान कंपनी के कुल बिना बिके उत्पादों का कितना प्रतिशत है (लगभग)
1. 102%
2. 112%
3. 153%
4. 122%
5. 132%
4. Find the average number of unsold items by all the company in 2018.
2018 में सभी कंपनी द्वारा बिना बिकी वस्तुओं की औसत संख्या ज्ञात कीजिए।
1. 380
2. 280
3. 180
4. 300
5. 200

5. Find the ratio of unsold items by company N in 2019 to the sold product of company M in 2019.
2019 में कंपनी N द्वारा बिना बिकी वस्तुओं का 2019 में कंपनी M के द्वारा बेचीं गई वस्तुओं से अनुपात ज्ञात कीजिए।
1. 41:84
2. 84:41
3. 41:80
4. 31:84
5. 4:45