Set-43
the first pie chart shows the percentage distribution of technical application received from four zone, i.e., East, West, North, South zones and second pie chart shows the percentage distribution of non- technical application received from those four zones. Number of applications received for non- technical from all zones is 50% more than the number of applications received for technical from all zones. Note: x=90 degree
Sum of number of applications received under technical north zone and non-technical north zone is 280.
पहला पाई चार्ट चार क्षेत्रों- पूर्व, पश्चिम, उत्तर, दक्षिण क्षेत्रों से प्राप्त तकनीकी आवेदन के प्रतिशत वितरण को दर्शाता है और दूसरा पाई चार्ट उन चार क्षेत्रों से प्राप्त गैर-तकनीकी आवेदन के प्रतिशत वितरण को दर्शाता है। सभी क्षेत्रों से गैर-तकनीकी के लिए प्राप्त आवेदनों की संख्या सभी क्षेत्रों से तकनीकी के लिए प्राप्त आवेदनों की संख्या से 50% अधिक है। नोट: x=90 डिग्री
तकनीकी उत्तर क्षेत्र और गैर-तकनीकी उत्तर क्षेत्र के अंतर्गत प्राप्त आवेदनों की संख्या का योग 280 है।

1. The female candidate who applied for technical from east zone are what percent of the total applicants applied for non-technical, if the ratio of male and female who applied for technical from east zone is 5:3?
यदि पूर्वी क्षेत्र से तकनीकी के लिए आवेदन करने वाले पुरुष और महिला का अनुपात 5:3 है, तो पूर्वी क्षेत्र से तकनीकी के लिए आवेदन करने वाली महिला उम्मीदवार, गैर-तकनीकी के लिए आवेदन करने वाले कुल आवेदकों का कितना प्रतिशत है?
1. 10
2. 20
3. 30
4. 15
5. 25

2. If application fee for technical is Rs.500 and for non-technical is Rs.300 then find the total fee collection from west zone?
यदि तकनीकी के लिए आवेदन शुल्क 500 रुपये है और गैर-तकनीकी के लिए आवेदन शुल्क 300 रुपये है तो पश्चिम क्षेत्र से कुल शुल्क संग्रह ज्ञात कीजिए?
1. 90000
2. 45000
3. 40000
4. 85000
5. 80000

3. If 250 new students join technical and 360 new students join non-technical through an interim exam, then find the new ratio of students in technical and non-technical?
यदि एक अंतरिम परीक्षा के माध्यम से 250 नए छात्र तकनीकी में शामिल होते हैं और 360 नए छात्र गैर-तकनीकी में शामिल होते हैं, तो तकनीकी और गैर-तकनीकी में छात्रों का नया अनुपात ज्ञात कीजिये?
1. 65:91
2. 65:96
3. 72:95
4. 72:91
5. 91:92

4. Find the average of technical students in East and west zone and non-technical students of north zone.
पूर्व और पश्चिम क्षेत्र में तकनीकी छात्रों और उत्तर क्षेत्र के गैर-तकनीकी छात्रों का औसत ज्ञात कीजिए।
1. 155
2. 140
3. 120
4. 150
5. 100

5. The number of students in technical of east and west is what percent of non-tech students of south zone? (approx.)
पूर्व और पश्चिम के तकनीकी छात्रों की संख्या दक्षिण क्षेत्र के गैर-तकनीकी छात्रों का कितना प्रतिशत है? (लगभग)
1. 133
2. 144
3. 155
4. 167
5. 150

Set-44
The bar graph shows the percentage of student participated in annual function from different section in dancing and singing and the table shows the average number of students participated in dancing and student not participating in any of the competition. Read the following table carefully and answer the question given below.
बार ग्राफ नृत्य और गायन में विभिन्न वर्गों से वार्षिक समारोह में भाग लेने वाले विद्यार्थियों के प्रतिशत को दर्शाता है और तालिका नृत्य में भाग लेने वाले विद्यार्थियों और किसी भी प्रतियोगिता में भाग नहीं लेने वाले विद्यार्थियों की औसत संख्या को दर्शाती है। निम्नलिखित तालिका को ध्यानपूर्वक पढ़िए और नीचे दिए गए प्रश्न का उत्तर दीजिए।


1. Find the total number of girl student participated in dancing if the ratio of boy to girl in the section B, C and D is 11:4, 5:6 and 3:2 respectively.
नृत्य में भाग लेने वाली छात्राओं की कुल संख्या ज्ञात कीजिए, यदि वर्ग B, C और D में लड़के का लड़की से अनुपात क्रमशः 11:4, 5:6 और 3:2 है।
1. 158
2. 156
3. 150
4. 152
5. 160

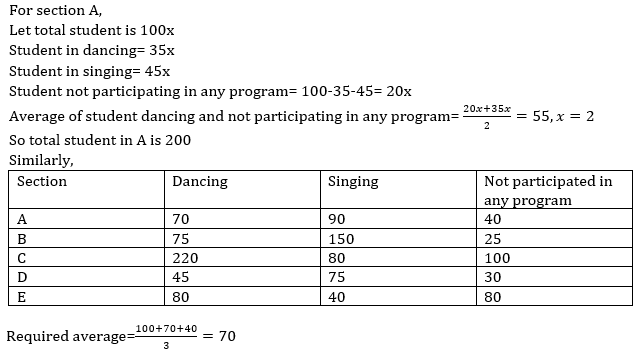
2. Find the average of student not participated in any program from the section C, participated in dancing from section A and participated in singing from section E.
वर्ग C से किसी भी प्रतियोगिता में भाग नहीं लेने वाले, वर्ग A से नृत्य में भाग लेने वाले और वर्ग E से गायन में भाग लेने वाले विद्यार्थियों का औसत ज्ञात कीजिए।
1. 71
2. 70
3. 72
4. 60
5. 50
3. The student participated in singing from B is what percent more or less the student not participated in any of the program from section C.
वर्ग B से गायन में भाग लेने वाले विद्यार्थी, वर्ग C से किसी भी प्रतियोगिता में भाग नहीं लेने वाले विद्यार्थी से कितने प्रतिशत कम या ज्यादा है?
1. 50%
2. 40%
3. 55%
4. 44%
5. 30%

4. Find the ratio of student participated in dancing to the singing.
नृत्य में भाग लेने वाले विद्यार्थियों का गायन में भाग लेने वाले विद्यार्थियों से अनुपात ज्ञात कीजिए।
1. 98:7
2. 8:87
3. 98:97
4. 98:87
5. 87:87

5. If at the annual function 25% of student from dancing and 10% student from singing in section E was absent and then same number of students joined from non -participated student to dancing and singing find the ratio of student remain in non -participated student to dancing and singing together.
यदि वार्षिक उत्सव में वर्ग E में नृत्य से 25% विद्यार्थी और गायन से 10% विद्यार्थी अनुपस्थित थे और फिर भाग नहीं लेने वाले विद्यार्थियों से इतनी ही संख्या में विद्यार्थी नृत्य और गायन में शामिल हुए। भाग नहीं लेने वाले शेष विद्यार्थियों का नृत्य और गायन को मिलाकर कुल विद्यार्थियों से अनुपात ज्ञात कीजिए।
1. 7:5
2. 17:15
3. 7:9
4. 9:5
5. 7:15

6. Find the difference of student in dancing from section D and E together to the singing from A and B together.
वर्ग D और E से मिलाकर नृत्य में भाग लेने वाले विद्यार्थी और A और B के मिलाकर गायन में भाग लेने वाले विद्यार्थियों के बीच अंतर ज्ञात कीजिए।
1. 115
2. 105
3. 156
4. 155
5. 165
