Set-47
Read the given pie chart carefully and answer the following questions.
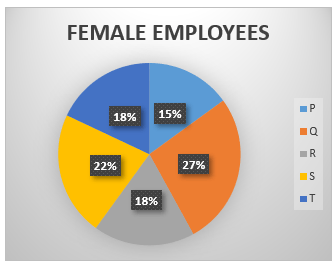
Pie chart (i) shows the percentage distribution total no. of employees in five different companies (P, Q, R, S and T) and pie chart (ii) shows percentage distribution no. of female employees in these five companies (P, Q, R, S and T)
Note: No. of female employees in company R is 18 more than that of company P.
दिए गए पाई चार्ट को ध्यान से पढ़िये और निम्नलिखित प्रश्नों के उत्तर दीजिये।
पाई चार्ट (i) पांच अलग-अलग कंपनियों (P, Q, R, S और T) में कर्मचारियों की कुल संख्या का प्रतिशत वितरण दर्शाता है और पाई चार्ट (ii) इन पांच कंपनियों (P, Q, R, S और T) में महिला कर्मचारियों की प्रतिशत वितरण संख्या दर्शाता है।
नोट: कंपनी R में महिला कर्मचारियों की संख्या कंपनी P से 18 अधिक है।

1. Find the difference between female employees in company Q and R together and the male employees in company S.
कंपनी Q और R में मिलाकर महिला कर्मचारियों और कंपनी S में पुरुष कर्मचारियों के बीच अंतर ज्ञात कीजिए।
1. 28
2. 10
3. 20
4. 21
5. 18

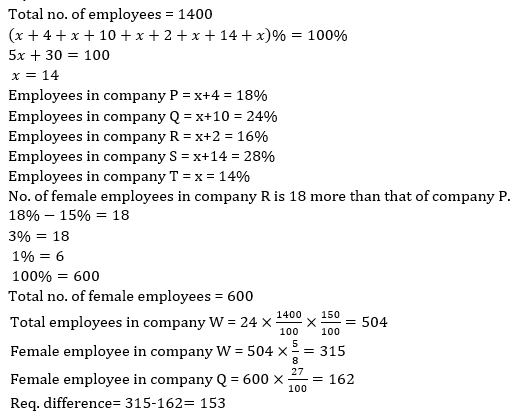
2. In company W total employees is 50% more than that of company Q. Ratio of male and female in company W is 3:5. Female of company Q is how much more /less than female of company W.
कंपनी W में कुल कर्मचारी कंपनी Q की तुलना में 50% अधिक है। कंपनी W में पुरुष और महिला कर्मचारियों का अनुपात 3:5 है। कंपनी Q की महिला कर्मचारी कंपनी W की महिला कर्मचारी से कितनी अधिक/कम है?
1. 153
2. 154
3. 180
4. 200
5. 700
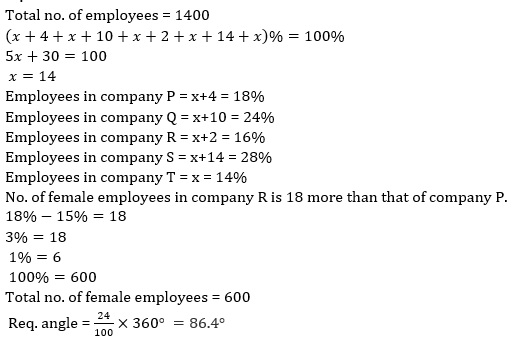
3. Find the central angle of total employees of company Q.
कंपनी Q के कुल कर्मचारियों का केंद्रीय कोण ज्ञात कीजिए।
1. 56.4°
2. 27.4°
3. 124.4°
4. 106.5°
5. 86.4°
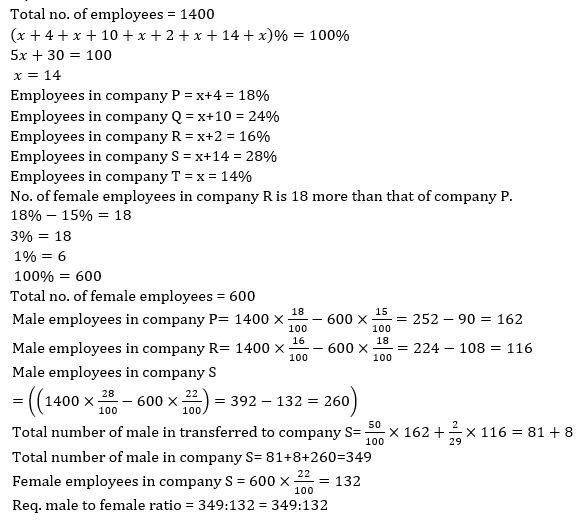
4. If 50% male in company P and 2/29th of male in company R transferred to company S then find the ratio of total male to female in company S.
यदि कंपनी P में 50% पुरुषों और कंपनी R में पुरुषों के 2/29वें भाग का कंपनी S में ट्रांसफर हो जाता है, तो कंपनी S में कुल पुरुषों का महिलाओं से अनुपात ज्ञात कीजिए।
1. 7:1
2. 5:2
3. 9:2
4. 349:132
5. 11:5
Set-48
Read the following bar graph and table carefully and answer the questions given below.
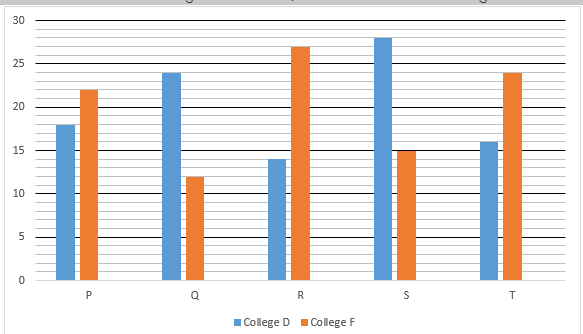
Following the bar graph shows percentage distribution total no. of students in five different department of college D and college F.
Note: Total no. of students in college D is 5500 and total no. of students in college F is 4800.
निम्नलिखित बार ग्राफ और तालिका को ध्यान से पढ़िये और नीचे दिए गए प्रश्नों के उत्तर दीजिये।
निम्नलिखित बार ग्राफ कॉलेज D और कॉलेज F के पांच अलग-अलग विभागों में विद्यार्थियों की कुल संख्या का प्रतिशत वितरण दर्शाता है।
नोट: कॉलेज D में विद्यार्थियों की कुल संख्या 5500 है और कॉलेज F में विद्यार्थियों की कुल संख्या 4800 है।
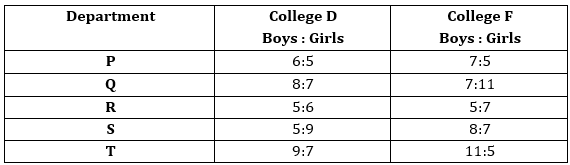
Following the table shows the ratio of boys to girls of five different departments in college D and college F.
1. 20% of total no. of girls of department P in college D transferred to college F in same department and 2/7 of total no. of boys of department P of college F transfer to college D in same department. Find the ratio of total no. of boys in college D to total no. of girls in college F of department P.
कॉलेज D में विभाग P की लड़कियों की कुल संख्या का 20% उसी विभाग में कॉलेज F में ट्रांसफर किया गया और कॉलेज F के विभाग P के लड़कों की कुल संख्या का 2/7 उसी विभाग में कॉलेज D में ट्रांसफर किया गया। कॉलेज D में लड़कों की कुल संख्या का कॉलेज F में विभाग P की लड़कियों की कुल संख्या से अनुपात ज्ञात कीजिए।
1. 358:265
2. 265:358
3. 265:359
4. 265:357
5. 267:358

2. Total no. of girls of department Q in college D and total no. of boys of department Q in college F participating in two different game i.e. hockey and tennis in the ratio of 4:3 and 5:9 respectively. Find the difference between total no. of students participating in hockey and total no. of students participating in tennis.
कॉलेज D में विभाग Q की लड़कियों की कुल संख्या और कॉलेज F में विभाग Q के लड़कों की कुल संख्या क्रमशः 4:3 और 5:9 के अनुपात में दो अलग-अलग खेलों- हॉकी और टेनिस में भाग लेती है। हॉकी में भाग लेने वाले विद्यार्थियों की कुल संख्या और टेनिस में भाग लेने वाले विद्यार्थियों की कुल संख्या के बीच का अंतर ज्ञात कीजिए।
1. 24
2. 20
3. 28
4. 12
5. 18

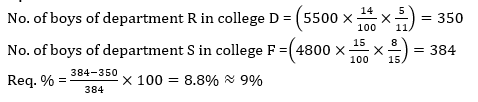
3. No. of boys of department R in college D is approximately what % more/less than no. of boys of department S in college F.
कॉलेज D में विभाग R के लड़कों की संख्या, कॉलेज F में विभाग S के लड़कों की संख्या से लगभग कितने प्रतिशत अधिक/कम है?
1. 17%
2. 27%
3. 5%
4. 9%
5. 14%
4. No. of boys of department U in college D is 25% more than no. of girls of department T in college F and no. of girls of department U in college D is 10% more than no. of boys of department S in college D. find the total no. of students of department U in college D.
कॉलेज D में विभाग U के लड़कों की संख्या कॉलेज F में विभाग T की लड़कियों की संख्या से 25% अधिक है और कॉलेज D में विभाग U की लड़कियों की संख्या कॉलेज D में विभाग S के लड़कों की संख्या से 10% अधिक है। कॉलेज D में विभाग U के छात्रों की कुल संख्या ज्ञात कीजिए।
1. 1205
2. 1142
3. 1650
4. 1780
5. 1055

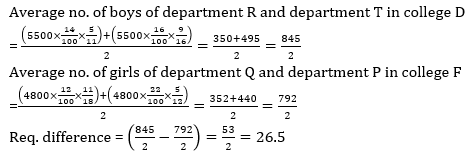
5. Average no. of boys of department R and department T in college D is how much more/less than average no. of girls of department Q and department P in college F.
कॉलेज D में विभाग R और विभाग T के लड़कों की औसत संख्या, कॉलेज F में विभाग Q और विभाग P की लड़कियों की औसत संख्या से कितनी अधिक/कम है?
1. 26.55
2. 26.5
3. 26
4. 25
5. 2.5