Set-77
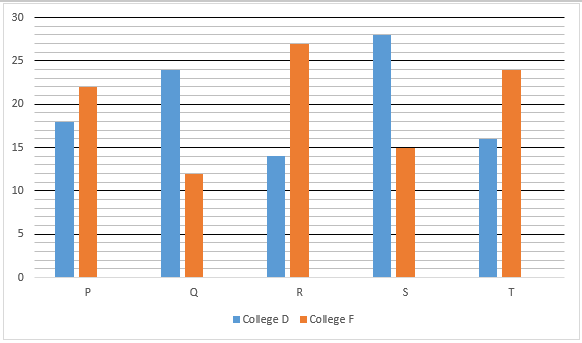
Read the following bar graph and table carefully and answer the questions given below.
Following the bar graph shows percentage distribution total no. of students in five different department of college D and college F.
Note: Total no. of students in college D is 5500 and total no. of students in college F is 4800.
निम्नलिखित बार ग्राफ और तालिका को ध्यान से पढ़िये और नीचे दिए गए प्रश्नों के उत्तर दीजिये।
निम्नलिखित बार ग्राफ कॉलेज D और कॉलेज F के पांच अलग-अलग विभागों में विद्यार्थियों की कुल संख्या का प्रतिशत वितरण दर्शाता है।
नोट: कॉलेज D में विद्यार्थियों की कुल संख्या 5500 है और कॉलेज F में विद्यार्थियों की कुल संख्या 4800 है।
Following the table shows the ratio of boys to girls of five different departments in college D and college F.

1. 20% of total no. of girls of department P in college D transferred to college F in same department and 2/7 of total no. of boys of department P of college F transfer to college D in same department. Find the ratio of total no. of boys in college D to total no. of girls in college F of department P.
कॉलेज D में विभाग P की लड़कियों की कुल संख्या का 20% उसी विभाग में कॉलेज F में ट्रांसफर किया गया और कॉलेज F के विभाग P के लड़कों की कुल संख्या का 2/7 उसी विभाग में कॉलेज D में ट्रांसफर किया गया। कॉलेज D में लड़कों की कुल संख्या का कॉलेज F में विभाग P की लड़कियों की कुल संख्या से अनुपात ज्ञात कीजिए।
1. 358:265
2. 265:358
3. 265:359
4. 265:357
5. 267:358

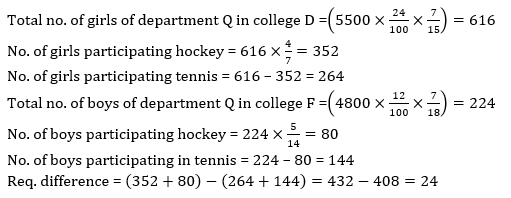
2. Total no. of girls of department Q in college D and total no. of boys of department Q in college F participating in two different game i.e. hockey and tennis in the ratio of 4:3 and 5:9 respectively. Find the difference between total no. of students participating in hockey and total no. of students participating in tennis.
कॉलेज D में विभाग Q की लड़कियों की कुल संख्या और कॉलेज F में विभाग Q के लड़कों की कुल संख्या क्रमशः 4:3 और 5:9 के अनुपात में दो अलग-अलग खेलों- हॉकी और टेनिस में भाग लेती है। हॉकी में भाग लेने वाले विद्यार्थियों की कुल संख्या और टेनिस में भाग लेने वाले विद्यार्थियों की कुल संख्या के बीच का अंतर ज्ञात कीजिए।
1. 24
2. 20
3. 28
4. 12
5. 18
3. No. of boys of department R in college D is approximately what % more/less than no. of boys of department S in college F.
कॉलेज D में विभाग R के लड़कों की संख्या, कॉलेज F में विभाग S के लड़कों की संख्या से लगभग कितने प्रतिशत अधिक/कम है?
1. 17%
2. 27%
3. 5%
4. 9%
5. 14%

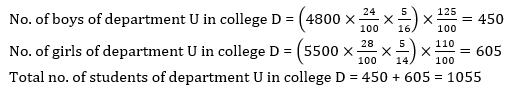
4. No. of boys of department U in college D is 25% more than no. of girls of department T in college F and no. of girls of department U in college D is 10% more than no. of boys of department S in college D. find the total no. of students of department U in college D.
कॉलेज D में विभाग U के लड़कों की संख्या कॉलेज F में विभाग T की लड़कियों की संख्या से 25% अधिक है और कॉलेज D में विभाग U की लड़कियों की संख्या कॉलेज D में विभाग S के लड़कों की संख्या से 10% अधिक है। कॉलेज D में विभाग U के छात्रों की कुल संख्या ज्ञात कीजिए।
1. 1205
2. 1142
3. 1650
4. 1780
5. 1055
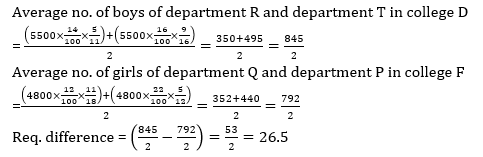
5. Average no. of boys of department R and department T in college D is how much more/less than average no. of girls of department Q and department P in college F.
कॉलेज D में विभाग R और विभाग T के लड़कों की औसत संख्या, कॉलेज F में विभाग Q और विभाग P की लड़कियों की औसत संख्या से कितनी अधिक/कम है?
1. 26.55
2. 26.5
3. 26
4. 25
5. 2.5
Set-78
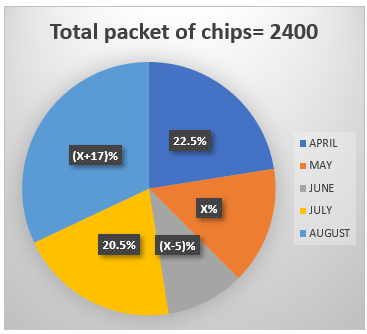
Read the pie chart carefully and answer the following question.
In the given pie chart percentage distribution of production of chips packet of two different flavors Cream & Onion and Spicy Tomato are given in 5 months.
पाई चार्ट को ध्यानपूर्वक पढ़िए और निम्नलिखित प्रश्नों के उत्तर दीजिये।
दिए गए पाई चार्ट में 5 माह में दो अलग-अलग फ्लेवर- क्रीम एंड अनियन और स्पाइसी टोमेटो वाले चिप्स के पैकेट के उत्पादन का प्रतिशत वितरण दिया गया है।
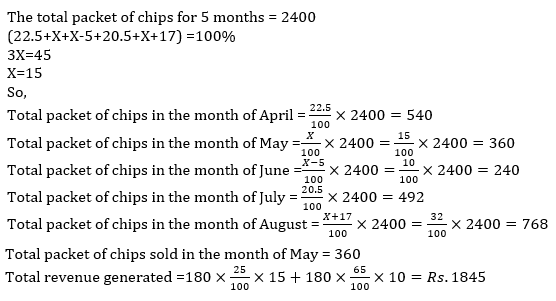
1. In the month of May, the production of Cream & Onion and Spicy Tomato are equal and the rate of each packet of Onion & Cream and Spicy Tomato are Rs.15 and Rs.10. Find the total revenue generated after selling 25% of Cream & Onion and 65% of Spicy Tomato. (in Rs).
मई माह में क्रीम एंड अनियन और स्पाइसी टोमेटो का उत्पादन बराबर होता है और क्रीम एंड अनियन और स्पाइसी टोमेटो के एक-एक पैकेट का भाव 15 रुपये और 10 रुपये है। 25% क्रीम एंड अनियन और 65% स्पाइसी टोमेटो बेचने के बाद उत्पन्न कुल राजस्व (रुपये में) ज्ञात कीजिए।
1. 1845
2. 1800
3. 1565
4. 975
5. 1215
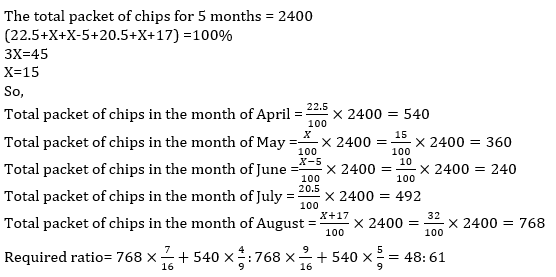
2. If the ratio of production of Cream & Onion flavor chips to that of Spicy Tomato chips in August and that in April is 7:9 and 4:5 respectively, then find the respective ratio of total number of chips produced of Cream & Onion to that of Spicy Tomato in August and April together.
यदि अगस्त में स्पाइसी टोमेटो के चिप्स और अप्रैल में क्रीम एंड अनियन के फ्लेवर के चिप्स के उत्पादन का अनुपात क्रमशः 7:9 और 4:5 है, तो क्रीम एंड अनियन से उत्पादित चिप्स की कुल संख्या का अगस्त और अप्रैल में स्पाइसी टोमेटो से संबंधित अनुपात ज्ञात कीजिए।
1. 48:53
2. 48:61
3. 49:61
4. 98:71
5. 8:1
3. In June, the production of packet of chips of Cream & Onion is 48 more than that of Spicy Tomato. The cost of each packet of Cream & Onion is Rs.15 and the cost of each packet of Spicy Tomato is 120% of that of Cream & Onion. On selling the all packets in the month of June revenue of Rs.X is generated. Find the value of X.
जून में क्रीम एंड अनियन के चिप्स के पैकेट का उत्पादन स्पाइसी टोमेटो की तुलना में 48 अधिक है। क्रीम एंड अनियन के प्रत्येक पैकेट की कीमत 15 रुपये है और स्पाइसी टोमेटो के प्रत्येक पैकेट की कीमत क्रीम एंड अनियन के पैकेट की कीमत का 120% है। जून के माह में सभी पैकेट बेचने पर X रुपये का राजस्व प्राप्त होता है। X का मान ज्ञात कीजिये।
1. 2088
2. 3640
3. 3888
4. 4128
5. 3364

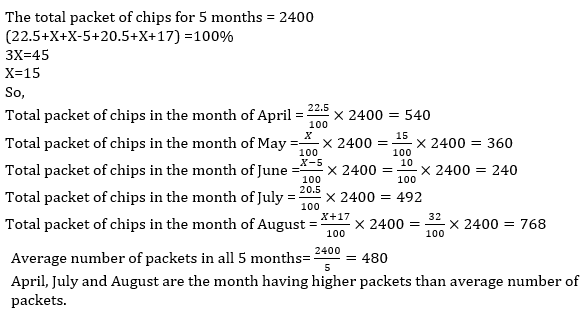
4. In which of the following month the total packets of chips produced is more than the average number of chips packet produced in all the month.
निम्नलिखित में से किस माह में उत्पादित चिप्स के कुल पैकेट पूरे माह में उत्पादित चिप्स पैकेट की औसत संख्या से अधिक है?
1. August
2. July and June
3. April, July and May
4. April, July and August
5. May
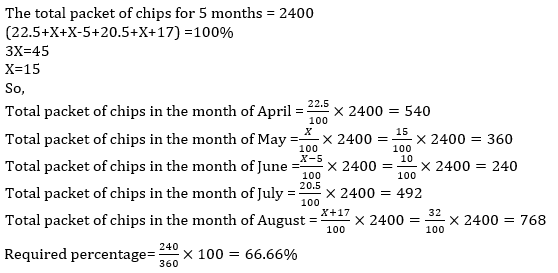
5. The packet of chips produced in the month of June is what percent of chips packet produced in the month of May?
जून के माह में उत्पादित चिप्स का पैकेट मई के माह में उत्पादित चिप्स के पैकेट का कितना प्रतिशत है?
1. 66.66%
2. 33.33%
3. 50%
4. 100%
5. 25%
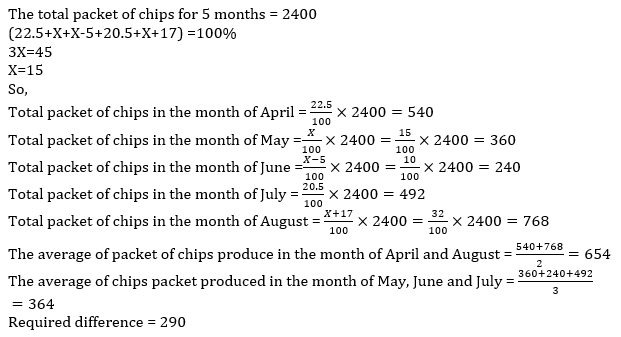
6. The average of packet of chips produced in the month of April and August is how much more or less than the average number of chips packet produced in the month of May, June and July?
अप्रैल और अगस्त के माह में उत्पादित चिप्स के पैकेट का औसत मई, जून और जुलाई के माह में उत्पादित चिप्स के पैकेट की औसत संख्या से कितना अधिक या कम है?
1. 280
2. 290
3. 275
4. 295
5. 200