Set-109
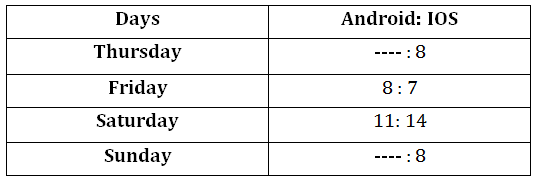
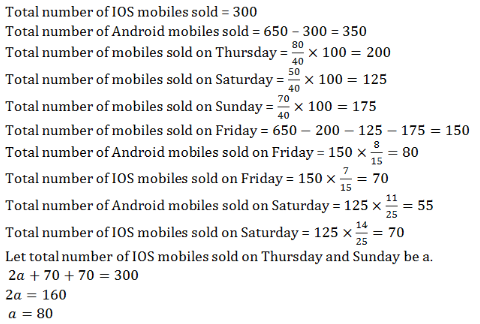
Total 650 mobiles (Android + IOS) are sold on four different days i.e., Thursday, Friday, Saturday and Sunday. Out of the total mobiles, 300 are IOS. On each day, some mobiles out of total mobiles sold are defective. The line graph below shows the total number of defective mobiles sold on Thursday, Saturday and Sunday. The table given below shows the ratio of Android and IOS mobiles sold on the given days.
Note: On each day, the total defective mobiles are 40% of the total mobiles sold on that day and total IOS mobiles sold on Thursday and Sunday is same.

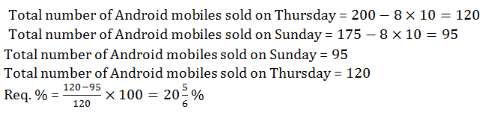
1. Total number of Android mobiles sold on Sunday is what percent more/less than that on Thursday?
1. 14(2/7)%
2. 33(1/3)%
3. 16(2/3)%
4. 20(5/6)%
5. 25(4/9)%

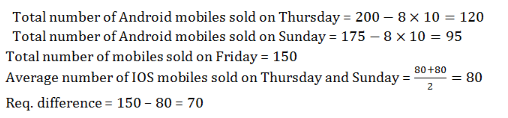
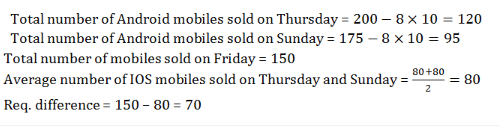
2. Total number of mobiles sold on Friday is how much more/less than average number of IOS mobiles sold on Thursday and on Sunday.
1. 35
2. 40
3. 50
4. 60
5. 70

3. Total number of mobiles sold on Friday is how much more/less than average number of IOS mobiles sold on Thursday and on Sunday.
1. 35
2. 40
3. 50
4. 60
5. 70
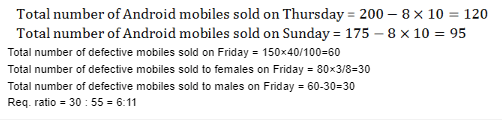
4. If total number of defective mobiles sold to females on Friday are 37.5% of the total defective mobiles sold Thursday, then find the ratio of total number of defective mobiles sold to males on Friday to total number of Android mobiles sold on Saturday.
1. 6:11
2. 11:6
3. 8:15
4. 15:8
5. None of these

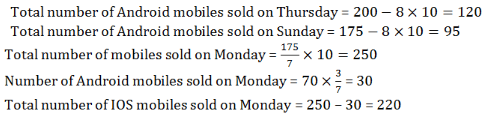
5. Total number of mobiles sold on Monday and Sunday are in the ratio of 10:7 respectively. If number of Android mobiles sold on Monday are 57(1/7)% less than IOS mobiles sold on Saturday, then find the total number of IOS mobiles sold on Monday.
1. 255
2. 225
3. 220
4. 275
5. 290

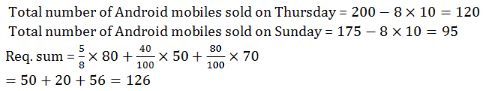
6. If 62.5%, 40% and 80% of defective mobiles on Thursday, Saturday & Sunday is return, then find the total number of mobiles returned on Thursday, Saturday & Sunday together.
1. 142
2. 126
3. 95
4. 107
5. 88

Set-110
The table shows total production (in kg) of three (wheat, rice and corn) different grains produced by five (P, Q, R, S & T) different farmers, percentage of wheat produced and ratio of rice to corn produced by these farmers. Few values are missing in the table. A candidate is expected to calculate the missing values, if it is required to answer the given question on the basis of the given data.
Note: Total quantity of grains produced = Quantity of wheat produced + Quantity of rice produced + Quantity of corn produced

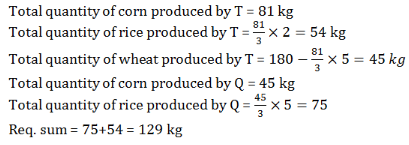
1. If total quantity of corn produced by T is 81 kg and total quantity of wheat produced by T is same as total quantity of corn produced by Q, then find the sum of total quantity of rice produced by Q and T.
1. 121 kg
2. 124 kg
3. 129 kg
4. 127 kg
5. 122 kg
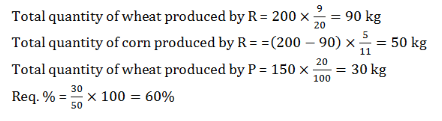
2. Total quantity of wheat produced by R is 9/20th of total quantity of grains produced by him. Find the total quantity of wheat produced by P is what percentage of total quantity of corn produced by R?
1. 80%
2. 50%
3. 75%
4. 45%
5. 60%
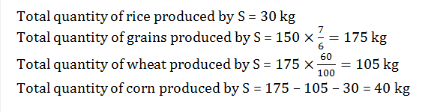
3. If total quantity of rice produced by S is 30 kg and total quantity of grains produced by him is 16⅔% more than that of P, then find the total quantity of corn produced by S.
1. 56 kg
2. 50 kg
3. 48 kg
4. 40 kg
5. 32 kg
4. The ratio of total quantity of wheat produced by T to P is 2:1 and total quantity of wheat produced by S is 350% of wheat produced by T. If ratio of total quantity of rice produced by S to T is 13:8, then find the total quantity of corn produced by S.
1. 69 kg
2. 62 kg
3. 65 kg
4. 68 kg
5. 70 kg

5. Total quantity of grains produced by X is 25% more than that of R and total quantity of wheat produced by X is 2/5th than that of Q. If total quantity of wheat produced by Q is 50% of the total quantity of grains produced by T, then find the total quantity of rice and corn together produced by X. (only three types of grains produced by X)
1. 209 kg
2. 210 kg
3. 218 kg
4. 214 kg
5. 212 kg
