Set-111
Read the following bar graph and table carefully and answer the questions given below.
Following the bar graph shows percentage distribution total number of students in five different departments of college D and college F.
Note: Total number of students in college D is 5500 and total number of students in college F is 4800.

Following the table shows the ratio of boys to girls in these five different departments in college D and college F.

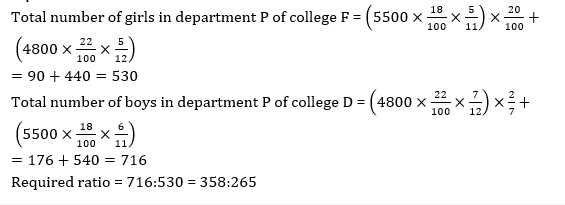
1. If 20% of total number of girls in department P of college D are transferred to college F in same department and 2/7 th of total number of boys in department P of college F are transferred to college D in same department, then find the ratio of total number of boys in department P of college D to total number of girls in department P of college F after transfer.
1. 358:265
2. 265:358
3. 265:359
4. 265:357
5. 267:358
2. Total number of girls in department Q of college D and total number of boys in department Q of college F are participating in two different games i. e. , hockey and tennis in the ratio of 4:3 and 5:9 respectively. Find the difference between total number of students are participating in hockey and total number of students are participating in tennis.
1. 24
2. 20
3. 28
4. 12
5. 18

3. Total number of boys in department R of college D are approximately what percent more or less than total number of boys in department S of college F.
1. 17%
2. 27%
3. 5%
4. 9%
5. 14%

4. Total number of boys in department U of college D are 25% more than total number of girls in department T of college F and total number of girls in department U of college D are 10% more than total number of boys in department S of college D. Find the total number of students in department U of college D.
1. 1205
2. 1142
3. 1650
4. 1780
5. 1055

5. The average number of boys in department R & department T of college D are how much more or less than the average number of girls in department Q & department P of college F.
1. 26.55
2. 26.5
3. 26
4. 25
5. 2.5

Set-112
The first pie chart shows the percentage distribution of technical application received from four zone, i. e. , East, West, North, South zones and second pie chart shows the percentage distribution of non- technical application received from those four zones. Number of applications received for non- technical from all zones is 50% more than the number of applications received for technical from all zones. Note: x=90 degree
Sum of number of applications received under technical north zone and non-technical north zone is 280.

1. The female candidate who applied for technical from east zone are what percent of the total applicants applied for non-technical, if the ratio of male and female who applied for technical from east zone is 5:3?
1. 10
2. 20
3. 30
4. 15
5. 25

2. If application fee for technical is Rs. 500 and for non-technical is Rs. 300 then find the total fee collection from west zone?
1. 90000
2. 45000
3. 40000
4. 85000
5. 80000

3. If 250 new students join technical and 360 new students join non-technical through an interim exam, then find the new ratio of students in technical and non-technical?
1. 65:91
2. 65:96
3. 72:95
4. 72:91
5. 91:92

4. Find the average of technical students in East and west zone and non-technical students of north zone.
1. 155
2. 140
3. 120
4. 150
5. 100

5. The number of students in technical of east and west is what percent of non-tech students of south zone? (approx. )
1. 133
2. 144
3. 155
4. 167
5. 150
