Set-15
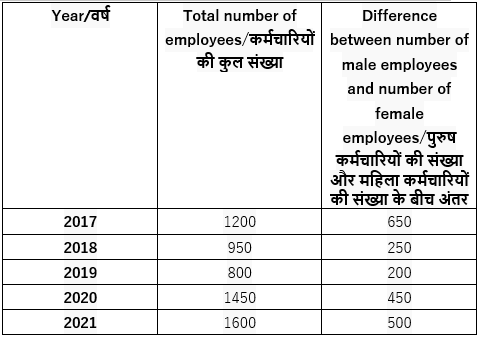
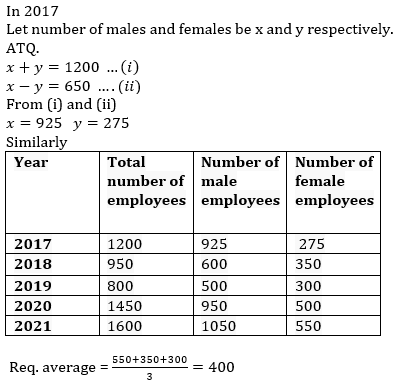
Read the following table carefully and answer the questions given below. Table shows total number of employees (males +females) and difference between number of male employees and female employees in a company in five different years.
Note: Number of males is more than number of females in each year.
निम्न सारणी को ध्यानपूर्वक पढ़िए और नीचे दिए गए प्रश्नों के उत्तर दीजिए। सारणी पांच अलग-अलग वर्षों में एक कंपनी में कर्मचारियों की कुल संख्या (पुरुष + महिला) तथा पुरुष कर्मचारियों और महिला कर्मचारियों की संख्या के बीच अंतर को दर्शाती है।
ध्यान दीजिए: प्रत्येक वर्ष पुरुषों की संख्या, महिलाओं की संख्या से अधिक है।
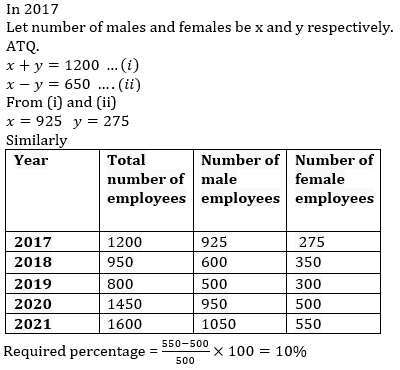
1. Number of female employees in 2021 is what percent more/less than number of male employees in 2019?
2021 में महिला कर्मचारियों की संख्या, 2019 में पुरुष कर्मचारियों की संख्या से कितने प्रतिशत अधिक/कम है?
1. 15%
2. 10%
3. 5%
4. 20%
5. 25%
2. Male and female employees in 2020 work in H.R. and Sales are in the ratio 11:8 and 14:11 respectively. Find the difference between number of employees work in H.R. and that in Sales (Note: In given years all the employees work only in HR and Sales)?
2020 में, मानव संसाधन और विक्रय में कार्यरत पुरुष कर्मचारियों और महिला कर्मचारियों का अनुपात क्रमश: 11:8 और 14:11 है। मानव संसाधन और विक्रय में कार्यरत कर्मचारियों की संख्या के बीच अंतर ज्ञात कीजिए (ध्यान दीजिए: दिए गए वर्षों में सभी कर्मचारी केवल मानव संसाधन और विक्रय में कार्य करते हैं)?
1. 210
2. 245
3. 190
4. 285
5. 160

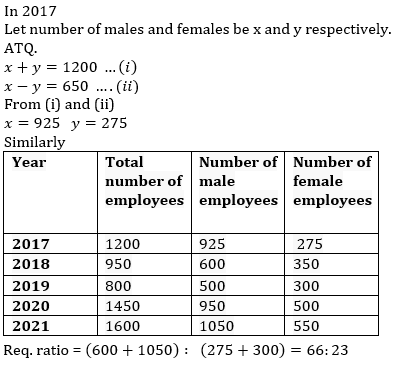
3. Find the ratio of male employees in 2018 and 2021 together to female employee in 2017 and 2019 together?
2018 और 2021 में एक साथ पुरुष कर्मचारियों का 2017 और 2019 में एक साथ महिला कर्मचारियों से अनुपात ज्ञात कीजिए?
1. 61:25
2. 66:29
3. 65:22
4. 66:23
5. 67:25
4. Number of female employees in 2022 are 55% more than male employees in 2019. If ratio of total employees in 2018 to male employees in 2022 is 10:3 respectively, then find the total number of employees in 2022?
2022 में महिला कर्मचारियों की संख्या, 2019 में पुरुष कर्मचारियों की संख्या से 55% अधिक है। यदि 2018 में कर्मचारियों की कुल संख्या का 2022 में पुरुष कर्मचारियों की संख्या से अनुपात क्रमशः 10:3 है, तो 2022 में कर्मचारियों की कुल संख्या ज्ञात कीजिए?
1. 945
2. 860
3. 1240
4. 1125
5. 1060

5. Find the average number of female employees in 2021, 2018 and 2019?
2021, 2018 और 2019 में महिला कर्मचारियों की औसत संख्या ज्ञात कीजिए?
1. 450
2. 400
3. 520
4. 600
5. 250
Set-16
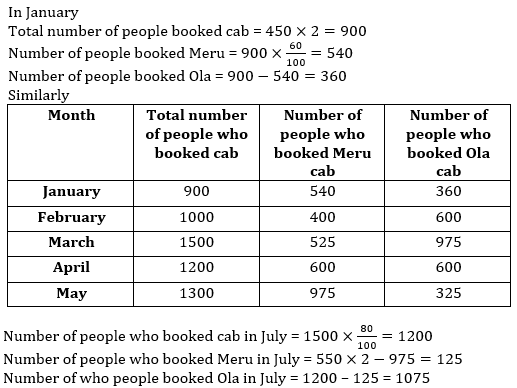
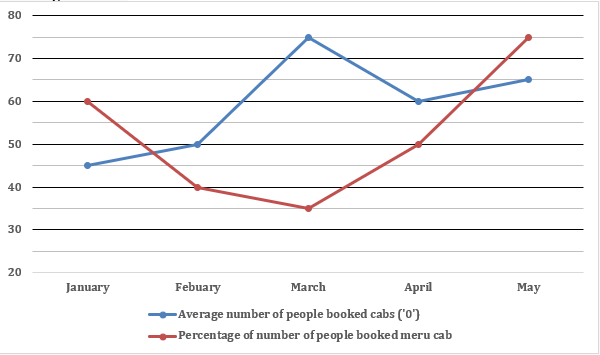
Read the following line chart carefully and answer the questions given below. Line chart shows average number of people who booked cab (Meru and Ola) and percentage of number of people who booked Meru cab in five different months.
Note: Only two types of cabs (Meru and Ola) booked by people and each person book only 1 cab.
निम्न रेखा आलेख को ध्यानपूर्वक पढ़िए और नीचे दिए गए प्रश्नों के उत्तर दीजिए। रेखा आलेख पांच अलग-अलग महीनों में कैब (मेरु और ओला) बुक करने वाले लोगों की औसत संख्या तथा मेरु कैब बुक करने वाले लोगों की संख्या का प्रतिशत दर्शाता है।
ध्यान दीजिए: लोगों द्वारा केवल दो प्रकार की कैब (मेरु और ओला) बुक की जाती हैं और प्रत्येक व्यक्ति केवल एक कैब बुक करता है।
1. Number of people who booked Ola in April is what percent more/less than number of people who booked Meru in February?
अप्रैल में ओला बुक करने वाले लोगों की संख्या, फरवरी में मेरु बुक करने वाले लोगों की संख्या से कितने प्रतिशत अधिक/कम है?
1. 50%
2. 20%
3. 70%
4. 40%
5. 80%

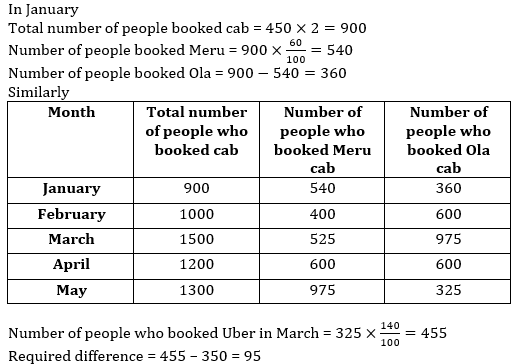
2. If number of people who booked Uber in March is 40% more than number of people who booked Ola in May, then find the difference between number of people who booked Ola in January and number of people who booked Uber in March?
यदि मार्च में उबर बुक करने वाले लोगों की संख्या, मई में ओला बुक करने वाले लोगों की संख्या से 40% अधिक है, तो जनवरी में ओला बुक करने वाले लोगों की संख्या और मार्च में उबर बुक करने वाले लोगों की संख्या के बीच अंतर ज्ञात कीजिए?
1. 110
2. 95
3. 85
4. 65
5. 70
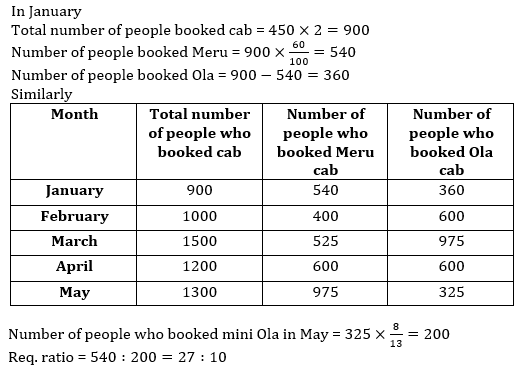
3. Ratio of Sedan Ola to mini-Ola booked by people in May is 5:8 respectively. Find the ratio of number of people who booked Meru in January to number of people who booked mini-Ola in May.(Note: Only two type of Ola cab)?
मई में लोगों द्वारा बुक की गई सिडान ओला का मिनी-ओला से अनुपात क्रमशः 5:8 है। जनवरी में मेरु बुक करने वाले लोगों की संख्या का मई में मिनी-ओला बुक करने वाले लोगों की संख्या से अनुपात ज्ञात कीजिए। (ध्यान दीजिए: केवल दो प्रकार की ओला कैब हैं)?
1. 24 :19
2. 27 :8
3. 21 :17
4. 27 :10
5. 22 :15
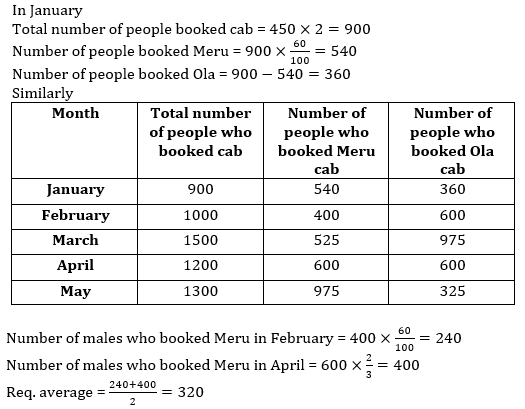
4. Number of males who booked Meru in February and April are 60% and Find the average number of males who booked Meru in February and April?
फरवरी और अप्रैल में मेरु बुक करने वाले पुरुषों की संख्या 60% और है। फरवरी और अप्रैल में मेरु बुक करने वाले पुरुषों की औसत संख्या ज्ञात कीजिए?
1. 320
2. 210
3. 180
4. 455
5. 560
5. Number of people who booked cab in July are 20% less than that in March. If average number of people who booked Meru in May and July is 550, then find the number of people who booked Ola in July?
जुलाई में कैब बुक करने वाले लोगों की संख्या, मार्च की तुलना में 20% कम है। यदि मई और जुलाई में मेरु बुक करने वालों की औसत संख्या 550 है, तो जुलाई में ओला बुक करने वाले लोगों की संख्या ज्ञात कीजिए?
1. 1250
2. 1075
3. 1140
4. 1055
5. 885