Set-55
Study the following information carefully and answer the following questions.
निम्नलिखित जानकारी का ध्यानपूर्वक अध्ययन करें और निम्नलिखित प्रश्नों के उत्तर दें।
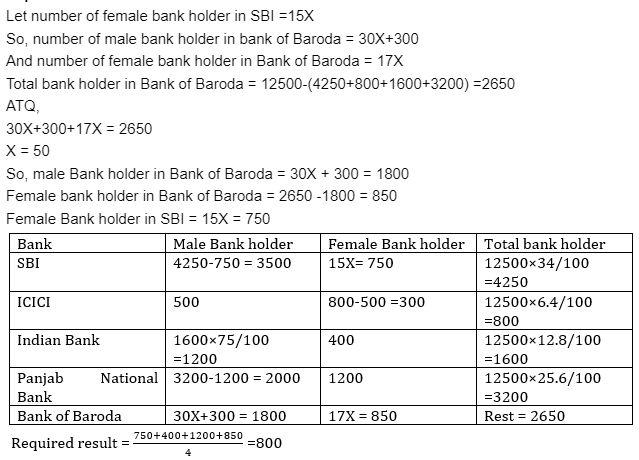
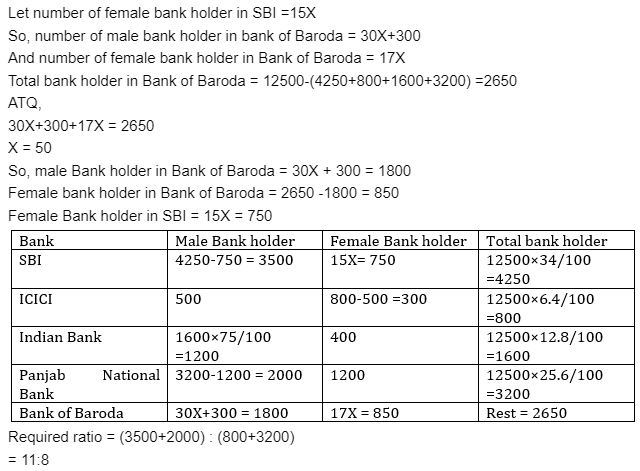
A survey was conducted on 12500 people of village which shows each member of village have a bank account but all member have different bank account. i.e. SBI, ICICI, Indian Bank, Panjab National Bank and Bank of Baroda. 34% of candidate have a bank account in SBI, 6.4% have account in ICICI, 12.8% have an account in Indian Bank, 25.6% have a bank account in PNB and rest of candidate have a bank account in Bank of Baroda.
गांव के 12500 लोगों पर एक सर्वेक्षण किया गया जिसमें पता चला कि गांव के प्रत्येक सदस्य का बैंक खाता है लेकिन सभी सदस्यों का बैंक खाता अलग है। अर्थात् SBI, ICICI, इंडियन बैंक, PNB और बैंक ऑफ़ बड़ौदा। 34% उम्मीदवारों का SBI में बैंक खाता है, 6.4% का ICICI में खाता है, 12.8% का इंडियन बैंक में खाता है, 25.6% का PNB में बैंक खाता है और शेष उम्मीदवारों का बैंक ऑफ़ बड़ौदा में बैंक खाता है।
500 male candidates have ICICI bank account, 75% of Indian bank account holders are male and number of male account holder in Indian bank and number of female account holder in Panjab National Bank are same. Number of male bank account holder in Bank of Baroda is 300 more than two times female bank account holder in SBI. Ratio between number of female SBI bank account holder and number of female Bank of Baroda bank account holder is 15:17.
500 पुरुष उम्मीदवारों के पास ICICI बैंक खाता है, 75% इंडियन बैंक के खाताधारक पुरुष हैं और इंडियन बैंक में पुरुष खाताधारकों की संख्या और PNB में महिला खाताधारकों की संख्या समान है। बैंक ऑफ़ बड़ौदा में पुरुष बैंक खाताधारकों की संख्या SBI में महिला बैंक खाताधारक के दो गुना से 300 अधिक है। महिला SBI बैंक खाताधारकों की संख्या और महिला बैंक ऑफ़ बड़ौदा बैंक खाताधारकों की संख्या के बीच का अनुपात 15:17 है।
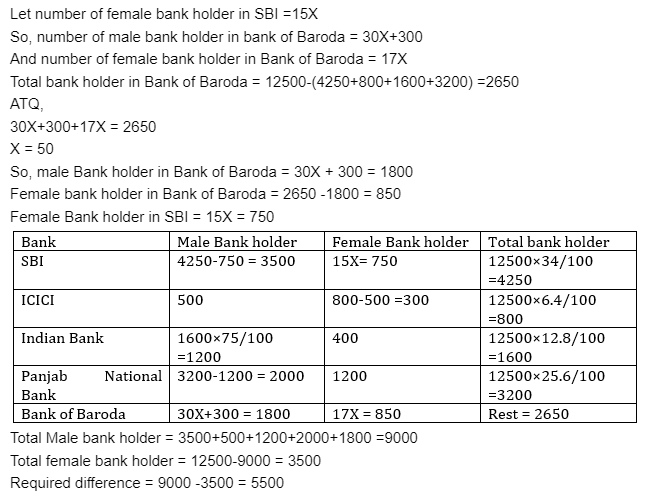
1. What is the difference between number of male bank holder and number of female bank holder from all six banks?
सभी छह बैंकों में पुरुष बैंक धारकों और महिला बैंक धारकों की संख्या के बीच का अंतर कितना है?
1. 4800
2. 5200
3. 4600
4. 5500
5. 5800
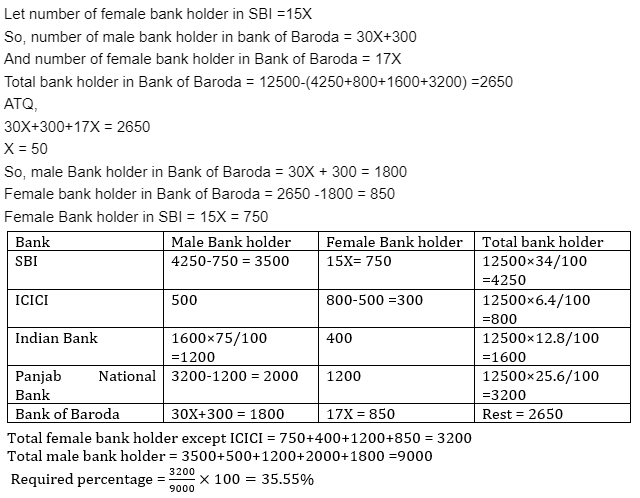
2. Total number of female banks holder except ICICI is what percent of total number of male bank holder?
ICICI को छोड़कर महिला बैंक धारकों की कुल संख्या पुरुष बैंक धारकों की कुल संख्या का कितना प्रतिशत है?
1. 32.5%
2. 35.5%
3. 30.5%
4. 38.5%
5. 40.25%
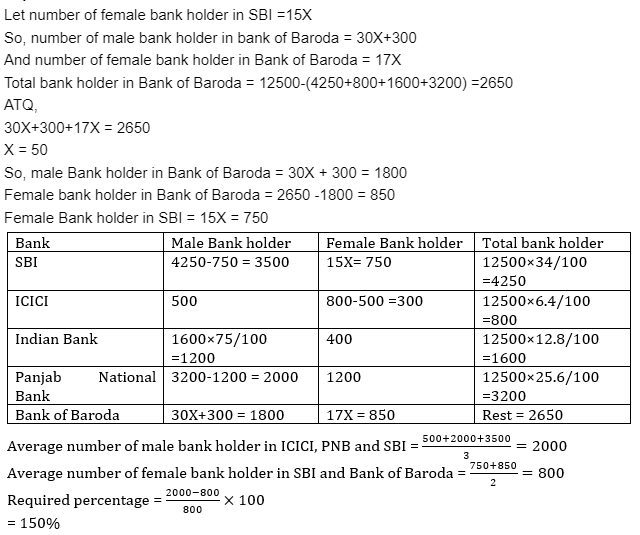
3. Average number of male bank holder in ICICI, Panjab national Bank and SBI is what percent more or less than average of female bank holder in SBI and bank of Baroda together?
ICICI, PNB और SBI में पुरुष बैंक धारकों की औसत संख्या SBI और बैंक ऑफ़ बड़ौदा में मिलाकर महिला बैंक धारकों की औसत संख्या से कितने प्रतिशत अधिक या कम है?
1. 50%
2. 250%
3. 150%
4. 100%
5. 66%
4. What is average of all female bank account holders except ICICI bank account holder?
ICICI बैंक खाताधारकों को छोड़कर सभी महिला बैंक खाताधारकों का औसत क्या है?
1. 700
2. 684
3. 750
4. 850
5. 800
5. Find out the ratio of male bank holder in SBI and PNB together to total bank holder in ICICI and PNB together?
SBI और PNB में मिलाकर पुरुष बैंक धारकों का ICICI और PNB में मिलाकर कुल बैंक धारकों से अनुपात ज्ञात कीजिए।
1. 11:8
2. 8:11
3. 13:7
4. 7:13
5. 3:8
Set-56
Study the pie chart and table given below carefully and answer the following questions.
नीचे दिए गए पाई-चार्ट और तालिका का ध्यानपूर्वक अध्ययन करें और निम्नलिखित प्रश्नों के उत्तर दें।
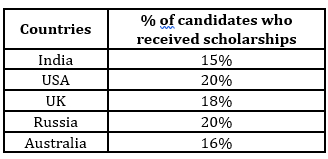
Pie chart shows percentage distribution of total number of candidates who applied for scholarship of CFA in 5 different countries (India, USA, UK, Russia and Australia) and table shows percentage of candidates who received scholarships out of total candidates who applied for scholarship in each of these 5 countries.
Total candidates who applied for scholarship of CFA = Candidates received scholarship + Candidates who do not received scholarship
पाई चार्ट 5 अलग-अलग देशों (भारत, अमेरिका, ब्रिटेन, रूस और ऑस्ट्रेलिया) में CFA की छात्रवृत्ति के लिए आवेदन करने वाले उम्मीदवारों की कुल संख्या के प्रतिशत वितरण को दर्शाता है और तालिका पांच देशों में से प्रत्येक में छात्रवृत्ति के लिए आवेदन करने वाले उम्मीदवारों में से छात्रवृत्ति प्राप्त करने वाले उम्मीदवारों के प्रतिशत को दर्शाती है।
कुल उम्मीदवार जिन्होंने CFA की छात्रवृत्ति के लिए आवेदन किया है = छात्रवृत्ति प्राप्त करने वाले उम्मीदवार + छात्रवृत्ति प्राप्त नहीं करने वाले उम्मीदवार
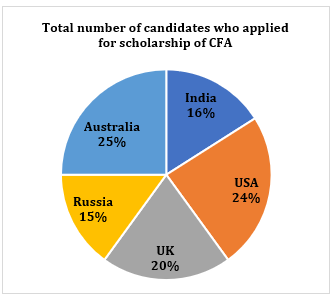
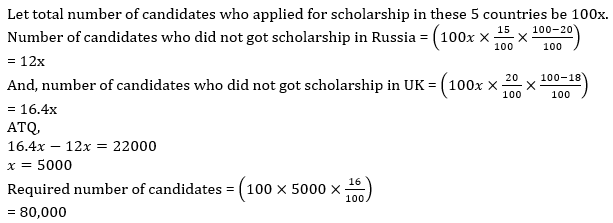
1. If number of candidates who did not got scholarship in Russia are 22,000 less than number of candidates who did not got scholarship in UK, then find number of candidates who applied for scholarship from India.
यदि रूस में छात्रवृत्ति नहीं पाने वाले उम्मीदवारों की संख्या, ब्रिटेन में छात्रवृत्ति नहीं पाने वाले उम्मीदवारों की संख्या से 22,000 कम है, तो भारत से छात्रवृत्ति के लिए आवेदन करने वाले उम्मीदवारों की संख्या ज्ञात कीजिये।
1. 80,000
2. 75,000
3. 72,000
4. 85,000
5. 90,000
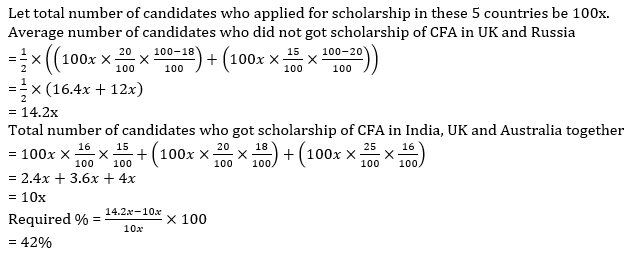
2. Average number of candidates who did not got scholarship of CFA in UK and Russia are what percent more or less than total number of candidates who got scholarship of CFA in India, UK and Australia together?
ब्रिटेन और रूस में CFA की छात्रवृत्ति नहीं पाने वाले उम्मीदवारों की औसत संख्या, भारत, ब्रिटेन और ऑस्ट्रेलिया में मिलाकर CFA की छात्रवृत्ति पाने वाले उम्मीदवारों की कुल संख्या से कितने प्रतिशत अधिक या कम है?
1. 50%
2. 64%
3. 42%
4. 48%
5. 56%
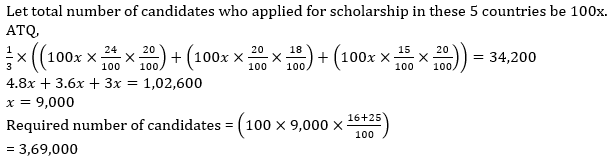
3. If average number of candidates who got scholarship of CFA in USA, UK and Russia is 34,200, then find total number of candidates who applied for scholarship in India and Australia together.
यदि अमेरिका, ब्रिटेन और रूस में CFA की छात्रवृत्ति पाने वाले उम्मीदवारों की औसत संख्या 34,200 है, तो भारत और ऑस्ट्रेलिया में मिलाकर छात्रवृत्ति के लिए आवेदन करने वाले उम्मीदवारों की कुल संख्या ज्ञात कीजिये।
1. 3,96,000
2. 4,52,000
3. 3,05,000
4. 3,69,000
5. 2,88,000
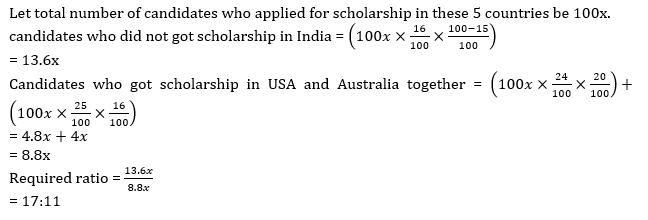
4. Find ratio of candidates who did not got scholarship in India to candidates who got scholarship in USA and Australia together.
भारत में छात्रवृत्ति नहीं पाने वाले उम्मीदवारों का, अमेरिका और ऑस्ट्रेलिया में मिलाकर छात्रवृत्ति पाने वाले उम्मीदवारों से अनुपात ज्ञात कीजिये।
1. 7 : 3
2. 11 : 8
3. 9 : 5
4. 5 : 8
5. 17 : 11