Set-89
Pie chart given below shows percentage distribution of students in five different schools and table shows percentage of students who like M.S. Dhoni and ratio of students who like Virat kohli & Rohit sharma in these five schools. Read the data carefully and answer the questions.
Note- These three players are liked by the students from all five schools.
नीचे दिया गया पाई चार्ट पांच अलग-अलग स्कूलों में छात्रों के प्रतिशत वितरण को दर्शाता है और तालिका इन पांच स्कूलों में एमएस धोनी को पसंद करने वाले छात्रों को, तथा विराट कोहली और रोहित शर्मा को पसंद करने वाले छात्रों के अनुपात को दर्शाती है। आंकड़ों को ध्यान से पढ़ें और प्रश्नों के उत्तर दें।
नोट- इन तीन खिलाड़ियों को सभी पांच स्कूलों के छात्रों द्वारा पसंद किया जाता है।

1. If there are two other schools P and Q in which 37.5% & 40% students like M.S. Dhoni, and ratio of students who like Virat kohli and Rohit sharma from P & Q is 3 : 2 and 7 : 9 respectively. If sum of students who like Virat kohli from P & Q is 531 and total students who like Rohit sharma from Q is 97 more than that from P, then find ratio of total students who like Virat kohli from C & total students who like M.S. Dhoni from P & Q together?
यदि दो अन्य स्कूल P और Q हैं जिनमें 37.5% और 40% छात्र एमएस धोनी को पसंद करते हैं तथा P और Q से विराट कोहली और रोहित शर्मा को पसंद करने वाले छात्रों का अनुपात क्रमशः 3: 2 और 7: 9 है। यदि P और Q से विराट कोहली को पसंद करने वाले छात्रों की संख्या 531 है और Q से रोहित शर्मा को पसंद करने वाले कुल छात्र P से 97 अधिक है, तो C से विराट कोहली को पसंद करने वाले छात्र तथा P & Q से एमएस. धोनी को पसंद करने वाले छात्रों का अनुपात ज्ञात कीजिये।
1. 75 : 323
2. 75 : 326
3. 75 : 328
4. 75 : 322
5. 75 : 338

2. Out of students who like Rohit sharma from D, 25% students also like Shikhar Dhawan and 16/21 th of remaining also like Rayudu. Find students who only like Rohit sharma from D is what percent less than total students who like Rohit sharma from A?
D से रोहित शर्मा को पसंद करने वाले छात्रों में से, 25% छात्र शिखर धवन को भी पसंद करते हैं और शेष का 16/21 छात्र रायुडू को भी पसंद करते हैं। D से रोहित शर्मा को पसंद करने वाले छात्र A से रोहित शर्मा को पसंद करने वाले छात्रों से कितने प्रतिशत कम है?
1. 35 ⅔%
2. 61 ⅓%
3. 31 ⅓%
4. 65 ⅓%
5. 63 ⅓%

3. Find the ratio of average number of students who like Virat kohli from A & E to total students who like M.S. Dhoni & Rohit Sharma together from B?
उन छात्रों की औसत संख्या का अनुपात ज्ञात करें जो A और E विराट कोहली को पसंद करते हैं, तथा जो छात्र B से एमएस धोनी और रोहित शर्मा को पसंद करते है?
1. 53 : 126
2. 53 : 128
3. 53 : 132
4. 53 : 130
5. 53 : 124

4. 2/7 th of students who like Rohit sharma from school C are girls, while 11/16 th of total students who like Virat Kohli are girls from D. Find total boys who like Rohit Sharma from C and total girls who like Virat Kohli from D together are what percent of total students who like M.S. Dhoni from A & C together?
C से रोहित शर्मा को पसंद करने वाले छात्रों का 2/7 लड़कियां हैं, जबकि D से विराट कोहली को पसंद करने वाले कुल छात्रों का 11/16 भाग लड़कियां हैं, C से रोहित शर्मा को पसंद करने वाले कुल लड़कों तथा D से विराट कोहली को पसंद करने वाली कुल लडकियां एकसाथ, A और C से एमएस धोनी को पसंद करने वाले छात्रों का कितने प्रतिशत है?
1. 44 ⅔%
2. 42⅔%
3. 40 ⅔%
4. 46 ⅔%
5. 48 ⅔%

5. Find the central angle (in degree) of students who like Virat Kohli from A, D & E?
A, D और E से विराट कोहली को पसंद करने वाले छात्रों का केंद्रीय कोण (डिग्री में) ज्ञात कीजिये।
1. 71.504
2. 63.504
3. 68.504
4. 75.504
5. 69.504

Set-90
Bar graph shows percentage distribution of total number of laptops sold by five (P, Q, R, S & T) different sellers. Read the following bar graph carefully and answer the questions given below.
Note: (i) Total number of laptops (sold + unsold) each seller P, Q & S have are less than 101.
(ii) Difference between number of laptops sold by S and P is 28.
(iii) Total number of laptops each seller have is equal to number of laptops sold and number of laptops unsold.
(iv) No one sold all the laptops.

1. Number of unsold laptops by R is 75% more than number of laptops sold by Q. If ratio of total number of dell to hp laptops (sold + unsold) of R is 3:7, then find the total number of dell laptops (sold + unsold) of R.
1. 66
2. 51
3. 72
4. 98
5. 49

2. 9.09% of total number of laptops sold by P transferred to S for selling. Find the difference between minimum and maximum possible laptops (sold + unsold) of shop S.
1. 31
2. 28
3. 24
4. 27
5. 35

3. Find the ratio of maximum possible value of unsold laptops by P to minimum possible value of unsold laptops by S.
1. 1:5
2. 5:9
3. 11:4
4. 12:1
5. None of these

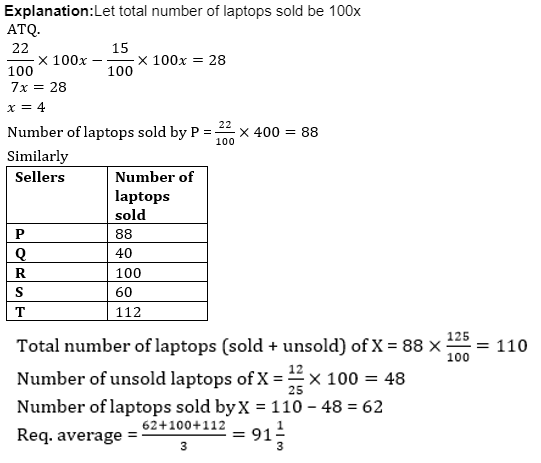
4. Total number of laptops (sold + unsold) of X is 25% more than number of laptops sold by P and number of unsold laptops of X is 12/25th of number of laptops sold by R. Find the average number of laptops sold by X, T and R.
1. 77 ⅓
2. 102 ⅓
3. 65 ⅓
4. 84 ⅓
5. 91 ⅓