Set-103
Read the following line graph and table carefully and answer the questions given below.
Following the line graph show percentage distribution total number of animals in five different Zoos. Table shows ratio of tigers, lions & foxes in each Zoo. Few values are missing in the table. The candidate is expected to calculate the missing values, if it is required to answer the given question on basis of the given data.
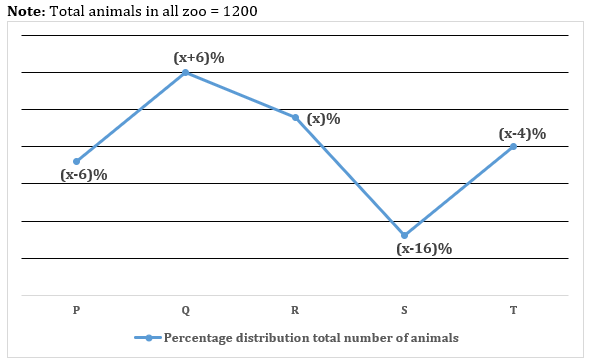

1. Total number of foxes in P are 20% more than that in R and total number of lions in P is 28% less than total number of tigers in T. Find the total tigers in P.
1. 40
2. 48
3. 52
4. 50
5. 55

2. Total animals in zoo U are 75% that in zoo Q and total tigers in U are 25% of total number of animals in R. If total tigers in T and lions in zoo U are same, then find the total foxes in zoo U.
1. 98
2. 120
3. 88
4. 75
5. 100

3. If average number of foxes in R & T and lions in S is then find the total number of tigers in S is what percent of total number of lions in T?
1. 45%
2. 60%
3. 20%
4. 25%
5. 50%

4. If total number of tigers in Q is 3/4 of the total number of lions in R, then find the total number of foxes in Q is how much more/ less than average number of animals in P & S.
1. 26
2. 12
3. 21
4. 25
5. 98

Set-104
Read the following bar graph carefully and answer the questions given below.
Bar graph shows percentage distribution of distance (in km) travelled by fives (A, B, C, D & E) cars and percentage distribution of speed of these five cars.
Note: Sum of speed of all these cars = 200 km/h.

1. If car C covers 600 km, then what is the difference between time taken by car A and car D to complete whole journey?
1. 24 min
2. 12 min
3. 20 min
4. 45 min
5. 38 min

2. If the distance travelled by car B is 68 km more than that of car E, then find the time taken by car D to cover whole journey.
1. 1 hour 20 min
2. 2 hour 24 min
3. 2 hour 30 min
4. 1 hour 25 min
5. 1 hours 40 min

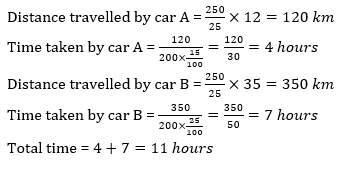
3. If the distance travelled by car C is 250km, what is the total time taken by car A and car B to cover whole journey?
1. 15 hours
2. 12 hours
3. 11 hours
4. 14 hours
5. 16 hours
4. If the car E can cover the whole journey in 15 hours, then find the ratio between time taken by car D to car C to cover whole journey?
1. 12:7
2. 10:9
3. 11:15
4. 16:15
5. 16:11
