Set-107
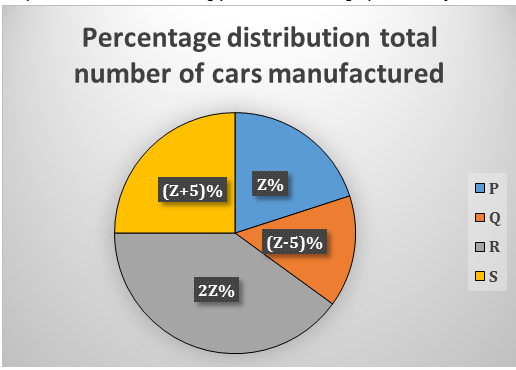
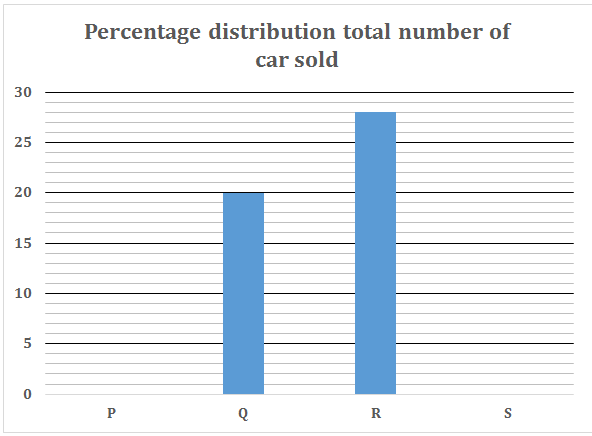
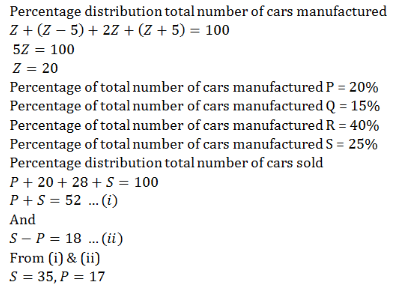
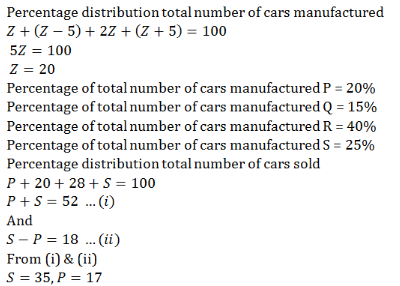
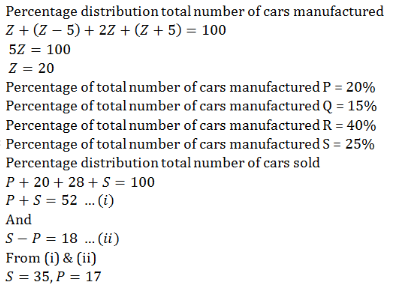
Pie chart shows percentage distribution total number of cars manufactured by four (P, Q, R & S) companies and bar graph shows percentage distribution total number of cars sold by these companies. Read the following pie chart and bar graph carefully and answer the questions given below.
Note: (I). Total number of cars sold by S is 18% more than that of P.
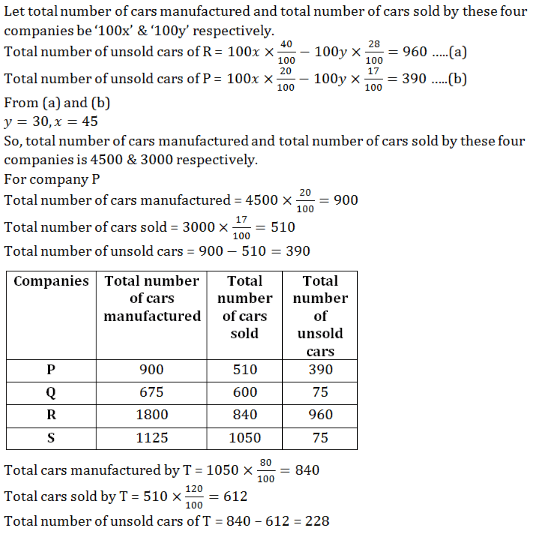
(II). Total number of unsold cars by R and P are 960 and 390 respectively.
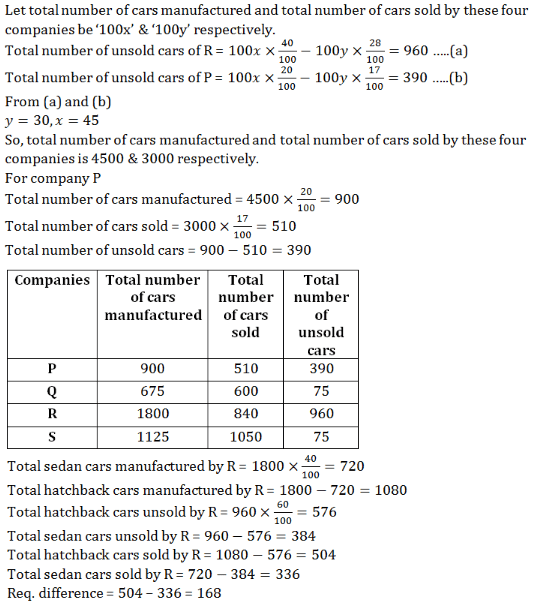
1. 40% of total cars manufactured by R is sedan and 60% of total unsold cars by R is hatchback. Find the difference between total sedan cars sold and total hatchback cars sold by R? (Only two types of cars manufactured and sold by R)
1. 124
2. 168
3. 146
4. 154
5. 166
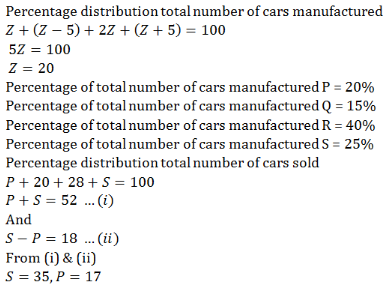
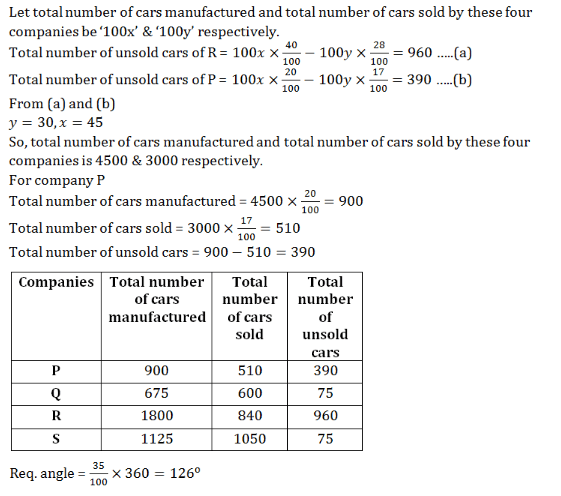
2. If we show the percentage distribution of total car sold on a pie chart, then find the central angle corresponding to total cars sold by S.
1. 126°
2. 75°
3. 216°
4. 90°
5. 106°
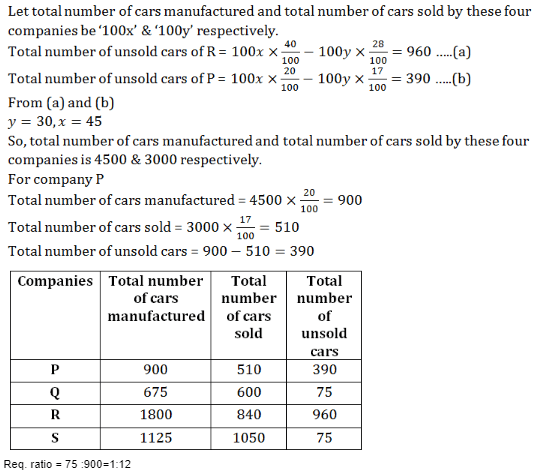
3. Find the ratio of total cars unsold by Q to total cars manufactured by P.
1. 4:15
2. 5:17
3. 4:7
4. 2:19
5. 1:12
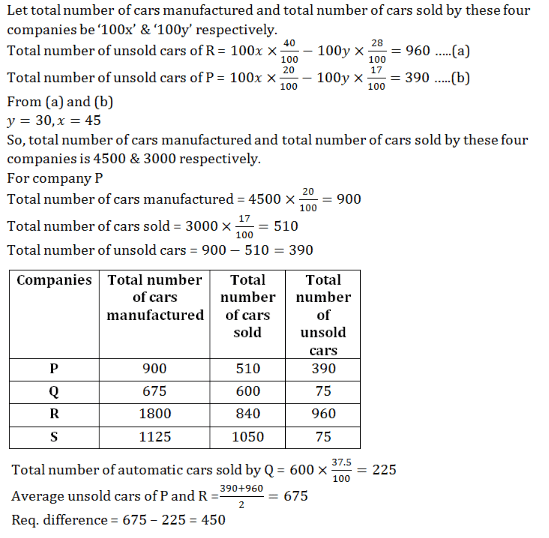
4. If 37.5% of total cars sold by Q are automatic, then the total number of automatic cars sold by Q is how much more/less than average cars unsold by P and R.
1. 250
2. 500
3. 450
4. 300
5. 350
5. If total cars manufactured by T are 80% of the total cars sold by S and total cars sold by T are 20% more than that by P, then find the total number of unsold cars of T.
1. 256
2. 228
3. 282
4. 298
5. 266
Set-108
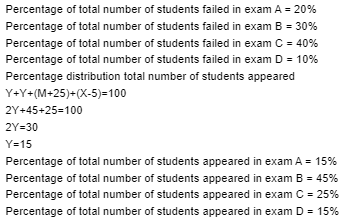
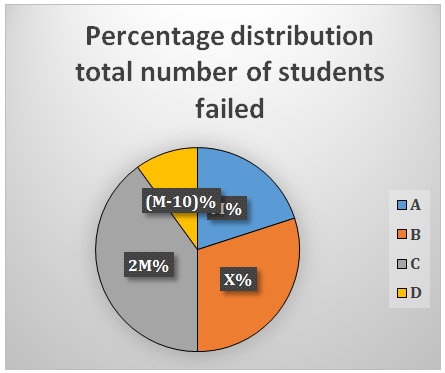
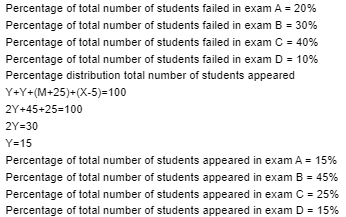
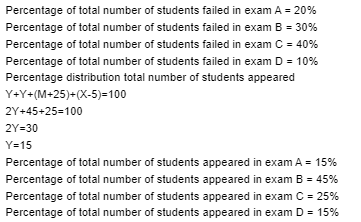
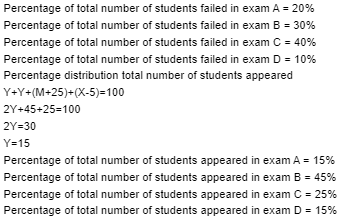
Pie chart (I) shows percentage distribution total number of students appeared and pie chart (II) shows percentage distribution total number of students failed in four (A, B, C & D) different exams. Read the following pie charts and bar graph carefully and answer the questions given below.
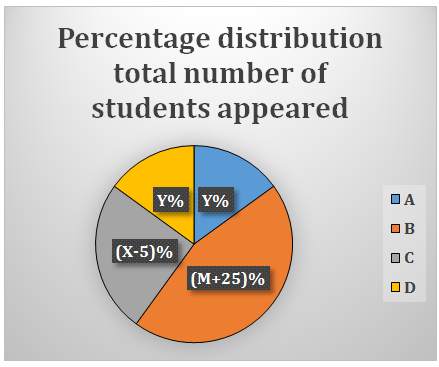
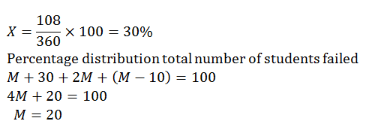
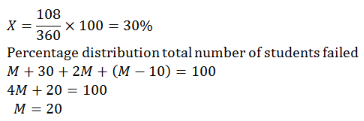
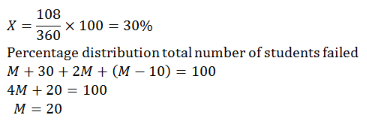
Note: (I). X= 108°
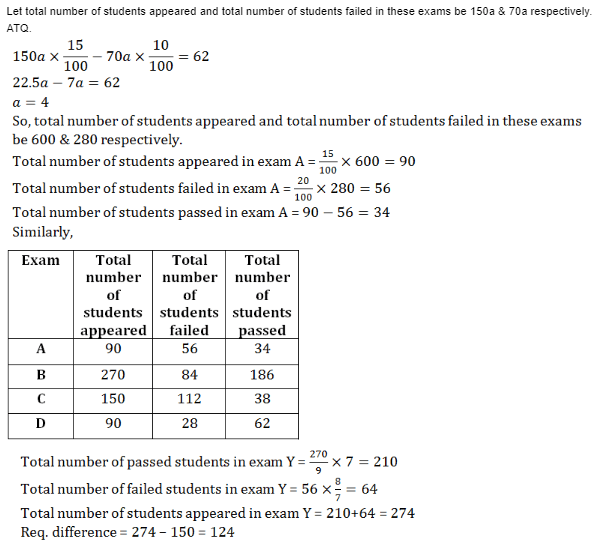
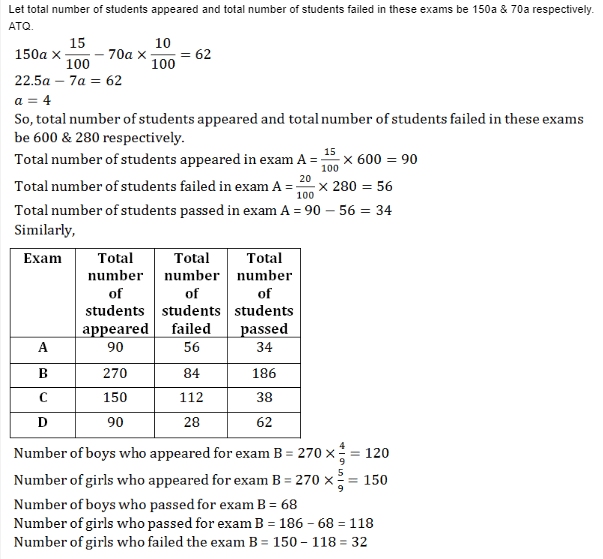
(II). Ratio of total number of students appeared and total number of students failed in these exams are 15:7 respectively.
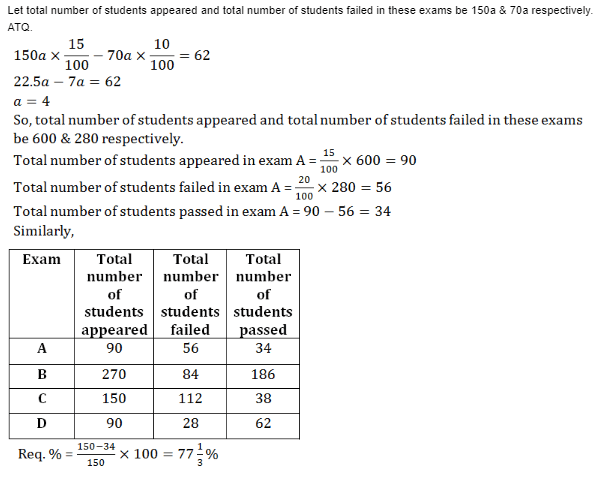
(III). Total number of students passed in exam D are 62.
(IV) Total number of students appeared = Total number of passed students + Total number of failed students.
1. If the ratio of number of boys to girls who appeared for exam B is 4 : 5. The number of boys who passed the same exam is 68, then find the number of girls who failed in exam B.
1. 35
2. 32
3. 38
4. 42
5. 29
2. Total number of students passed in exam E are 50% more than that in exam D. If total number of students appeared in exam C are 40% less than that of exam E, then find the total number of students failed in exam E.
1. 142
2. 167
3. 152
4. 162
5. 157

3. Total number of passed students in exam A is what percent more/less than total number of students appeared in exam C?
1. 77(1/3)%
2. 77(2/3)%
3. 55(2/3)%
4. 67(2/9)%
5. 61(2/9)%
4. Total number of students passed in exam Y and number of students appeared in exam B are in the ratio of 7:9 respectively. If total number of students failed in exam Y are 14 2/7% more than students failed in exam A, then find the difference between total number of students appeared in exam Y to that in exam C.
1. 124
2. 132
3. 146
4. 108
5. 92