Set-117
Line chart shows percentage distribution total number of cars manufactured by five (P, Q, R, S and T) different companies in 2020 and table shows difference between total number of cars manufactured in 2021 and 2022, percentage increment and decrement of total number of cars manufactured in 2021 and 2022 respectively. Read the following line chart and table carefully and answer the questions given below.
Note: (i) Percentage increment of total number of cars manufactured in 2021 is calculate with respect to total number of cars manufactured in 2020.
(ii) Percentage decrement of total number of cars manufactured in 2022 is calculate with respect to total number of cars manufactured in 2020.


1. In company P, total number of cars manufactured in 2020 is 25% more than in 2019 and ratio of car manufactured in 2018 to 2019 is 7:4. Find the ratio of total number of cars manufactured in 2018 to that in 2022 by P.
1. 1:1
2. 4:5
3. 2:3
4. 5:6
5. 2:1

2. Total number of buses manufactured in 2022 by Q is 11.11% more than total number of cars manufactured by R in 2022. If 40% of the buses sold to TCS and 25 employees can accommodate in each bus, then find the total number of employees in all the buses.
1. 500
2. 450
3. 240
4. 650
5. 100

3. 80% of total number of cars manufactured by T in 2021 are sold in two different cities i.e. A & B. If 60% of cars sold in city A, then find the total number of cars sold to city B are what percent of total number of cars manufactured by S in 2020.
1. 29%
2. 44%
3. 38%
4. 32%
5. 17%

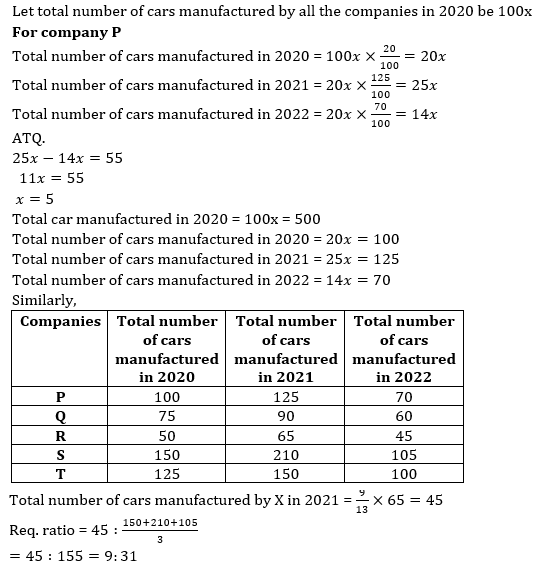
4. Total number of cars manufactured by company X in 2021 are 9/13th of total number of cars manufactured by R in 2021. Find the ratio of total number of cars manufactured by company X in 2021 to average number of cars manufactured by S in all the given years.
1. 9:31
2. 11:21
3. 4:19
4. 19:35
5. 22:29
Set-118
Table shows data regarding Rs.20 notes received by five (A, B, C, D & E) different banks during demonetization. Study the table given below and answer the following questions.

Note – (i). ‘Return’ is the amount (face value of note) of notes returned by bank to its customers.
(ii). Each bank has given minimum of 50% return on all notes received by it.
1. In bank A, note on which 50% return is given is 2500. Find the difference between value of Rs.20 note on which 100% return is given by bank A and value of Rs.20 notes received by bank E.
1. Rs.100000
2. Rs.300000
3. Rs.250000
4. Rs.150000
5. Rs.660000

2. In bank D, the difference between the notes which give 100% return and 80% return is 9500. Find the total number of notes received by bank D is what percentage more/less than that received by bank C.
1. 60%
2. 50%
3. 40%
4. 30%
5. 20%

3. The ratio of notes on which (50% return: 80% return) by bank E is same as the ratio of notes on which (50% return: 80% return) is given by bank C. Total note on which 100% return is given by bank E is 9000. Find the ratio of total notes received by bank A to notes on which 80% of return is given by E.
1. 2 : 3
2. 5 : 3
3. 5 : 4
4. 5 : 7
5. None of the above.

4. If the ratio of total number of notes on which 50% return and 80% return is given by bank B is 8:9 respectively, then find the total number of notes on which 80% of return is given by bank B.
1. 4000
2. 2000
3. 1400
4. 1800
5. Cannot be determined.

5. Find the notes on which 50% return is given by bank D is what percentage of 100% return is given by the same bank?
1. 10%
2. 6.66%
3. 8.33%
4. 15%
5. 12.5%
