Set-121
Read the following table carefully and answer the questions given below. the table shows total number of shirts (Denim and cotton) sold by a seller IN five different years and percentage of denim shirts sold by the sellers in the given years.

1. The total number of cotton shirts sold in 2021 is 25% more than that of in 2017. Total number of denim shirts sold in 2017 is 3/8 less than the denim shirts sold in 2019, then find the find the total number of shirts sold in 2017 is what percent of total shirts sold in 2020?
1. 82%
2. 78%
3. 45%
4. 52%
5. 66%


2. The ratio of total number of denim shirts sold in 2012 to 2019 is 5:8 and the selling price of each denim shirt and each cotton shirts sold in 2012 is Rs.250 and Rs.200 respectively. If average selling price of all shirts (denim and cotton) sold in 2012 is Rs.220, then find the total number of cotton shirts sold in 2012.
1. 90
2. 66
3. 78
4. 120
5. 85


3. Find the ratio of third highest number of denim shirts sold and second lowest number of cotton shirts sold in given five years.
1. None of these
2. 7:2
3. 1:4
4. 2:5
5. 5:3


4. There are two types (A&B) of denim shirts sold in 2019 and 2021. B type of denim shirts sold in 2021 is 14 more than that of A type denim shirt. A type of denim shirts sold in 2019 is 12 less than B type of denim shirts sold in 2021. A type of denim shirts sold in 2019 & 2021 together is how much more/less than B type of denim shirts sold in 2019 & 2021 together.
1. 30
2. 44
3. 55
4. 20
5. 18


5. 40% of the total number of shirts sold in 2022 are defective. If 4/7th of denim shirts sold in 2022 are defective, then find the non- defective cotton shirt sold in 2022.
1. 45
2. 58
3. 61
4. 64
5. 69


6. Total number of shirts sold in 2015 and cotton shirt sold in 2018 are in the ratio of 15:7 respectively and total number denim shirts sold in 2015 are 40% of the total number of shirts sold. Find the total number of cotton shirts sold in 2015 is what percent more/less than total shirts sold in 2019?
1. 6%
2. 8%
3. 12%
4. 9%
5. 14%


Set-122
Line graph shows total number of days taken by A, B, C, D & E to complete the whole work. Read the line graph carefully and answer the following questions.

1. A & B together works for x days and both left the work. The remaining work completed by P in y days. If efficiency of P is 40% less than D and the ratio of total work done by A & B to that by P is 7:3. Find the (y – x).
1. 9
2. 12
3. 18
4. 27
5. 24

2. A & E works for n days and they left the work. If the remaining work completed by one of the remaining three people and total number of days required to complete the work is an integer, then find value of n.
1. 1
2. 2
3. 3
4. 4
5. 5


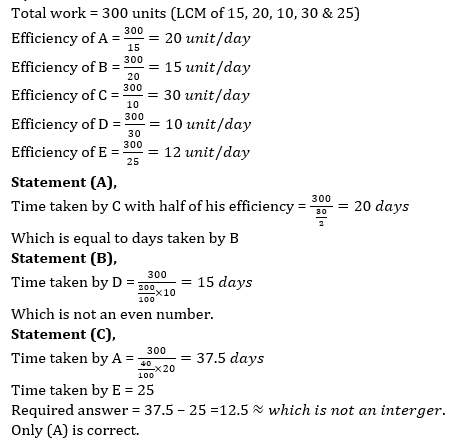
3. Which of the following statement(s) is/are correct?
(A) If C works with half of his efficiency, then he takes equal number of days as B.
(B) If D increases his efficiency by 100%, then he takes even number of days.
(C) If A decreases his efficiency by 60%, then difference between time taken by A and E is an integer .
1. Only C is correct
2. Only A is correct
3. Only B and C are correct
4. All three are correct
5. None of above