Set-71
The line graph shows the data of average manufacturing in 2018 and 2019 and manufacturing in 2019 of three companies, i.e., L, M and N. the table shows the sales data of 2018 and 2019.
लाइन ग्राफ तीन कंपनियों- L, M और N का 2018 और 2019 में औसत विनिर्माण और 2019 में विनिर्माण के आंकड़ों को दर्शाता है। तालिका 2018 और 2019 के बिक्री के आंकड़ों को दर्शाती है।


1. If unsold products of 2019 are later sold to a wholesaler at Rs. 350 each then find the total collection from unsold products in 2019.
यदि 2019 के बिना बिके उत्पादों को बाद में एक थोक व्यापारी को 350 रुपये पर बेचा जाता है, तो 2019 में बिना बिके उत्पादों का कुल संग्रह ज्ञात कीजिए।
1. 413000
2. 51300
3. 41300
4. 431000
5. 143678

2. Find the difference between the total unsold product of 2018 and the total unsold product of 2019.
2018 के कुल बिना बिके उत्पाद और 2019 के कुल बिना बिके उत्पाद के बीच का अंतर ज्ञात कीजिए।
1. 80
2. 40
3. 50
4. 30
5. 10

3. Total unsold products of company M in 2018 is what percent of total unsold products of the same company in 2019. (approx.)
2018 में कंपनी M के कुल बिना बिके उत्पाद 2019 में समान कंपनी के कुल बिना बिके उत्पादों का कितना प्रतिशत है (लगभग)
1. 102%
2. 112%
3. 153%
4. 122%
5. 132%

4. Find the average number of unsold items by all the company in 2018.
2018 में सभी कंपनी द्वारा बिना बिकी वस्तुओं की औसत संख्या ज्ञात कीजिए।
1. 380
2. 280
3. 180
4. 300
5. 200

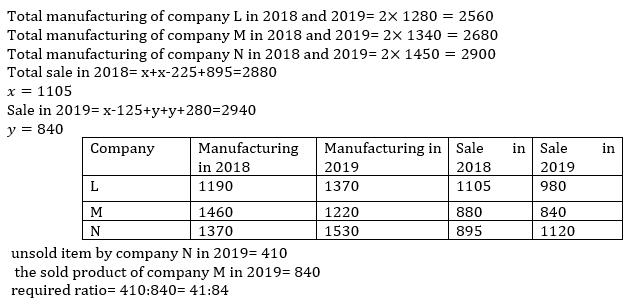
5. Find the ratio of unsold items by company N in 2019 to the sold product of company M in 2019.
2019 में कंपनी N द्वारा बिना बिकी वस्तुओं का 2019 में कंपनी M के द्वारा बेचीं गई वस्तुओं से अनुपात ज्ञात कीजिए।
1. 41:84
2. 84:41
3. 41:80
4. 31:84
5. 4:45
Set-72
The first pie chart shows the percentage distribution of technical application received from four zone, i.e., East, West, North, South zones and second pie chart shows the percentage distribution of non- technical application received from those four zones. Number of applications received for non- technical from all zones is 50% more than the number of applications received for technical from all zones. Note: x=90 degree
Sum of number of applications received under technical north zone and non-technical north zone is 280.
पहला पाई चार्ट चार क्षेत्रों- पूर्व, पश्चिम, उत्तर, दक्षिण क्षेत्रों से प्राप्त तकनीकी आवेदन के प्रतिशत वितरण को दर्शाता है और दूसरा पाई चार्ट उन चार क्षेत्रों से प्राप्त गैर-तकनीकी आवेदन के प्रतिशत वितरण को दर्शाता है। सभी क्षेत्रों से गैर-तकनीकी के लिए प्राप्त आवेदनों की संख्या सभी क्षेत्रों से तकनीकी के लिए प्राप्त आवेदनों की संख्या से 50% अधिक है। नोट: x=90 डिग्री
तकनीकी उत्तर क्षेत्र और गैर-तकनीकी उत्तर क्षेत्र के अंतर्गत प्राप्त आवेदनों की संख्या का योग 280 है।

1. The female candidate who applied for technical from east zone are what percent of the total applicants applied for non-technical, if the ratio of male and female who applied for technical from east zone is 5:3?
यदि पूर्वी क्षेत्र से तकनीकी के लिए आवेदन करने वाले पुरुष और महिला का अनुपात 5:3 है, तो पूर्वी क्षेत्र से तकनीकी के लिए आवेदन करने वाली महिला उम्मीदवार, गैर-तकनीकी के लिए आवेदन करने वाले कुल आवेदकों का कितना प्रतिशत है?
1. 10
2. 20
3. 30
4. 15
5. 25

2. If application fee for technical is Rs.500 and for non-technical is Rs.300 then find the total fee collection from west zone?
यदि तकनीकी के लिए आवेदन शुल्क 500 रुपये है और गैर-तकनीकी के लिए आवेदन शुल्क 300 रुपये है तो पश्चिम क्षेत्र से कुल शुल्क संग्रह ज्ञात कीजिए?
1. 90000
2. 45000
3. 40000
4. 85000
5. 80000

3. If 250 new students join technical and 360 new students join non-technical through an interim exam, then find the new ratio of students in technical and non-technical?
यदि एक अंतरिम परीक्षा के माध्यम से 250 नए छात्र तकनीकी में शामिल होते हैं और 360 नए छात्र गैर-तकनीकी में शामिल होते हैं, तो तकनीकी और गैर-तकनीकी में छात्रों का नया अनुपात ज्ञात कीजिये?
1. 65:91
2. 65:96
3. 72:95
4. 72:91
5. 91:92

4. Find the average of technical students in East and west zone and non-technical students of north zone.
पूर्व और पश्चिम क्षेत्र में तकनीकी छात्रों और उत्तर क्षेत्र के गैर-तकनीकी छात्रों का औसत ज्ञात कीजिए।
1. 155
2. 140
3. 120
4. 150
5. 100

5. The number of students in technical of east and west is what percent of non-tech students of south zone? (approx.)
पूर्व और पश्चिम के तकनीकी छात्रों की संख्या दक्षिण क्षेत्र के गैर-तकनीकी छात्रों का कितना प्रतिशत है? (लगभग)
1. 133
2. 144
3. 155
4. 167
5. 150
