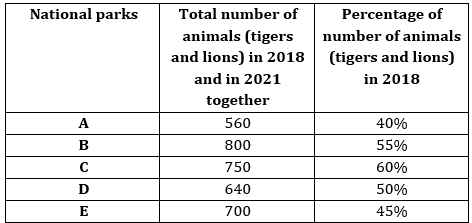
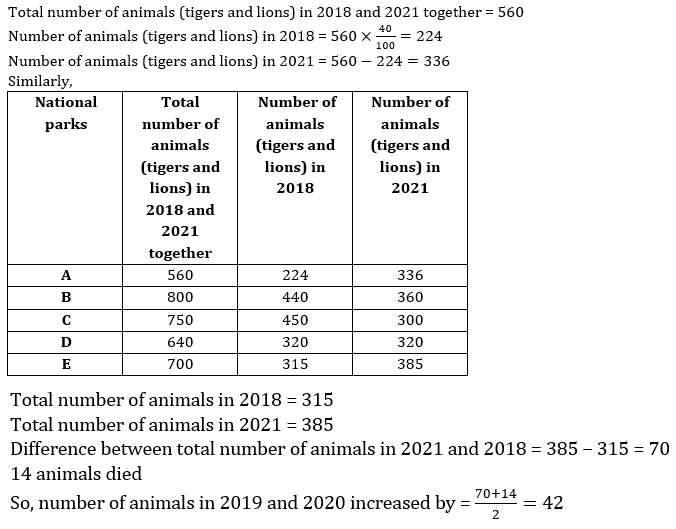
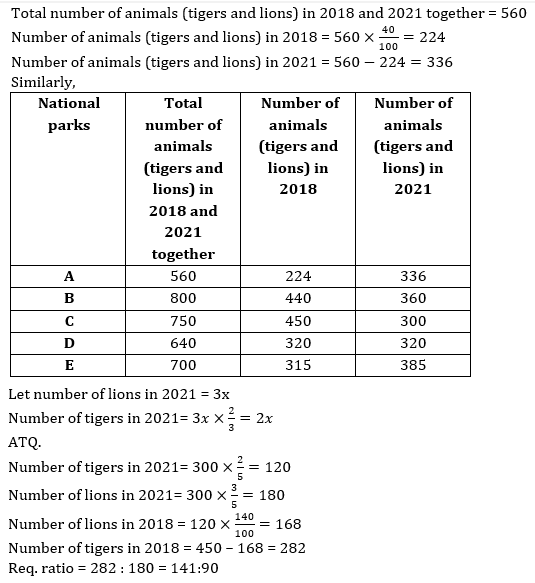
Set-91
Table shows total number of animals (tigers and lions) in five (A, B, C, D & D) different national parks in two (2018 and 2021) different years. Table also shows percentage of total number of animals (tigers and lions) in 2018. Read the following table carefully and answer the questions given below.
1. In A, if total number of animals increased by P% from 2018 to 2020, 20% from 2020 to 2021 and 2P% from 2021 to 2022, then find the total number of animals in 2022.
1. 450
2. 504
3. 498
4. 424
5. 540

2. In E, equal number of animals increased in 2019 and 2020 and from 2018 to 2021 only 14 animals died. Find the number of animals increased by 2020. (no other animals died or increased in any year other than the given information).
1. 20
2. 24
3. 29
4. 21
5. 42
3. In C, number of tigers in 2021 is 33. 33% less than that of lions and number of lions in 2018 is 40% more than number of tigers in 2021. Find the ratio of number of tigers in 2018 to number of lions in 2021.
1. 144:97
2. 141:90
3. 134:99
4. 147:95
5. 149:91
4. In D, total number of animals in 2019 is 25% more than that of in 2018 and ratio of number of tigers to number of lions is 9:7. Find the number of lions in 2019 is how much more/less than total number of animals in 2021 in A.
1. 158
2. 161
3. 149
4. 153
5. 167

Set-92
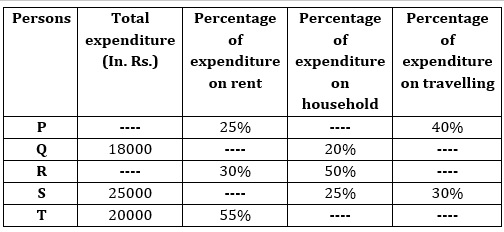
Table shows total monthly expenditure of five (P, Q, R, S & T) different persons and each person spend on three (household, rent & travelling) different types of things. Read the following table carefully and answer the questions given below.
Note: (I). Percentage distribution of sum of monthly expenditure of each person is 100.
(II). Total monthly expenditure of R is Rs.7500 more than the average monthly expenditure of S and T.
1. If expenditure on traveling by R to T are in the ratio of 2:1, then find the expenditure on household by T is what percent total expenditure of Q?
1. 16⅔%
2. 20%
3. 37½%
4. 25%
5. 33⅓%

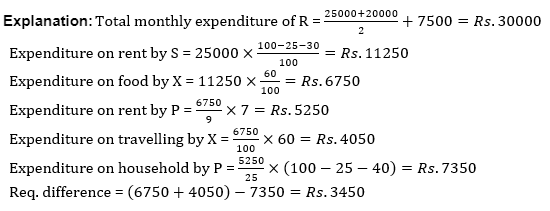
2. Expenditure on food by X is 60% of the expenditure on rent by S and ratio of expenditure on rent by P to expenditure on food by X is 7:9. If expenditure on travelling by X is 40% less than that on food, then find the difference between total expenditure by X (on food & travelling) and expenditure on household by P.
1. Rs.3450
2. Rs.1250
3. Rs.2285
4. Rs.4200
5. Rs.3840
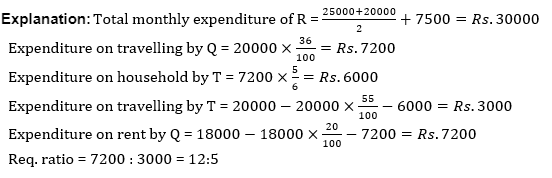
3. Expenditure on travelling by Q is 36% of the total expenditure by T and expenditure on household by T is 16⅔% less than expenditure on travelling by Q. Find the ratio of expenditure on rent by Q to expenditure on travelling by T.
1. 14:9
2. 7:4
3. 10:7
4. 12:5
5. 11:7
4. Ratio of total expenditure by P to S is 3:5 and monthly income of P is 8/5th of total expenditure of P. If P invest 50% of his saving in a scheme which offers 10% compound interest for three years, then find the total amount he received after three years.
1. Rs.6540.5
2. Rs.5420.5
3. Rs.4920.5
4. Rs.5989.5
5. Rs.5980.5

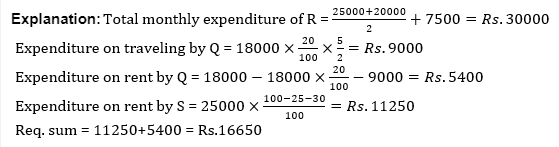
5. If ratio of expenditure on traveling to household by Q is 5:2, then find the sum of total expenditure on rent by Q and S together.
1. Rs.12480
2. Rs.16650
3. Rs.14200
4. Rs.18400
5. Rs.11250